Gold Elliott Wave Analysis: Anticipating the Next Bullish Phase
Gold Elliott Wave Analysis
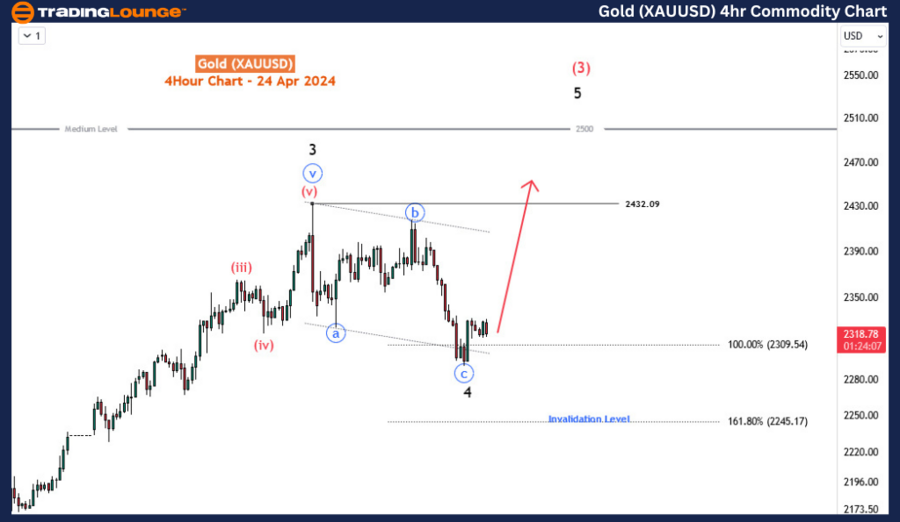
Function - Trend
Mode - Impulse
Structure - Impulse wave
Position -Wave 4
Direction - Wave 5
Details - Wave 4 has reached the extreme area and bounced off the 2300 MG1. We will expect wave 5 to progress higher. However, it’s still in the early stages. Invalidation below 2245.17.
Gold has undergone a retracement since its peak on April 12th, following a remarkable surge to a fresh all-time high. Despite this pullback, the underlying bullish momentum remains robust and is anticipated to reassert itself once the corrective phase concludes. In today's analysis, we delve into the potential areas where Gold may discover the necessary support to propel its next upward movements.
Zooming into the daily chart, our Elliott Wave analysis commences with identifying an impulse wave sequence originating from the low at 1614, marking the termination of wave (IV) at the supercycle degree back in September 2022. Presently, the supercycle wave V is unfolding, currently navigating through the third leg of the cycle degree, denoted as wave III. Within this wave III, classified as an impulse wave, we find ourselves within the third sub-wave, indicated as blue wave '3' of primary degree, further delineated into wave (3) of intermediate degree. Within this intricate structure, the price action appears to be nearing the culmination of minor degree wave 4. Consequently, the impulse sequence characterizing the intermediate wave (3) has yet to finalize, let alone the overarching supercycle wave (V). Thus, Gold's bullish trajectory remains firmly intact, advocating for a strategic approach of buying into the dips within this robust trend. Presently, the price appears to be undergoing a dip corresponding to wave 4 of (3), with an anticipated subsequent uptrend in wave 5.
Elliott Wave Technical Forecast for Gold 4-hour Chart Analysis
Transitioning to the H4 chart, our focus narrows on the completion of wave 4, manifesting as a zigzag pattern since the peak on April 12th. Conventionally, the termination of the third leg of a zigzag typically occurs at extensions ranging from 100% to 138.2% of the initial leg's length from the subsequent corrective move. However, an extension beyond 138.2%, particularly to 161.8%, tends to invalidate the zigzag pattern. In this context, we cautiously assert that the zigzag for wave 4 might have concluded, with a critical level of invalidation identified at 2245. Nonetheless, further confirmation is sought through the emergence of more bullish candle formations. Meanwhile, the target projection for wave 5 remains at 2500, aligning with the continuation of Gold's upward trajectory within the Elliott Wave framework.
Technical Analyst: Sanmi Adeagbo
Source: visit Tradinglounge.com and learn From the Experts Join TradingLounge Here
See Previous: Silver Elliott Wave Technical Analysis
TradingLounge's Free Week Extravaganza!
April 14 – 21: Unlock the Doors to Trading Excellence — Absolutely FREE