LINKUSD Elliott Wave Analysis – TradingLounge Daily Chart

Chainlink / U.S. Dollar (LINKUSD) Daily Chart Analysis

LINKUSD Elliott Wave Technical Analysis

Function: Follow Trend

Mode: Motive

Structure: Impulse

Position: Wave 3

Direction Next Higher Degrees:

Wave Cancel Invalid Level: $13.00

Chainlink (LINKUSD) Daily Chart Strategy – Elliott Wave Outlook

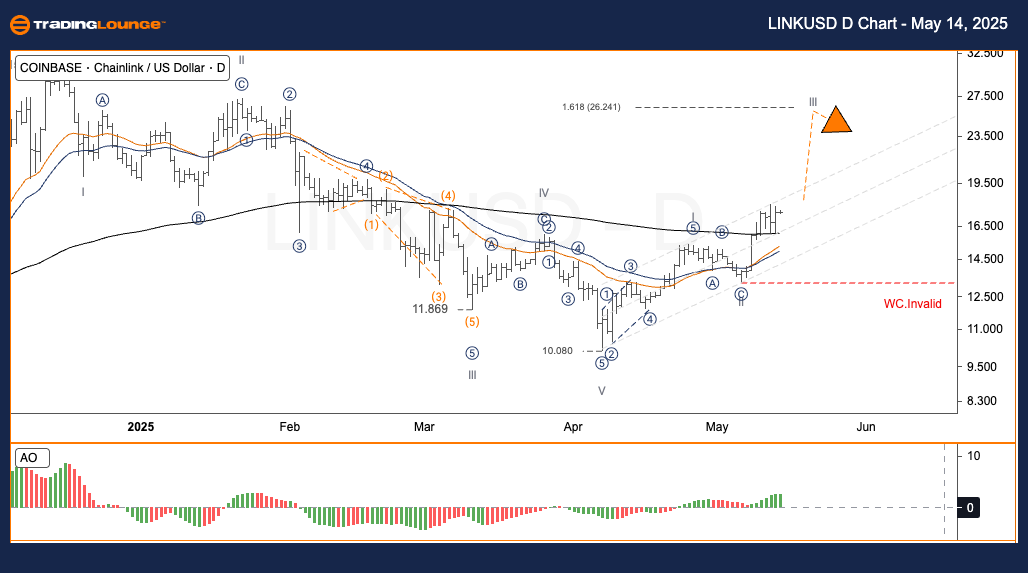
After completing wave II with a defined ABC corrective structure and maintaining key support levels, Chainlink (LINK) displays upward momentum. This price rebound signals the potential initiation of wave III, typically the most powerful move in the Elliott Wave cycle. Based on a Fibonacci extension of wave I, wave III could target the $26.24 level, aligning with a 1.618 extension. Holding above the midpoint of the price channel enhances the likelihood of reaching or exceeding this target.

The crucial invalidation threshold remains at $13.00. A drop below this price level invalidates the current Elliott Wave count and requires re-evaluation.

Trading Strategy – Daily Chart
Approach
:

✅ Swing Traders:

Monitor the $15–$16 range for potential entry points, which could represent wave 2 of the developing wave III structure.

Risk Management:

🟥 A move below $13.00 nullifies the current wave setup and suggests a need for recalculating the count.

LINKUSD-day-Crypto-c...


LINKUSD Elliott Wave Analysis – TradingLounge H4 Chart

Chainlink / U.S. Dollar (LINKUSD) 4-Hour Chart Analysis

LINKUSD Elliott Wave Technical Analysis

Function: Follow Trend

Mode: Motive

Structure: Impulse

Position: Wave 3

Direction Next Higher Degrees:

Wave Cancel Invalid Level: $13.00

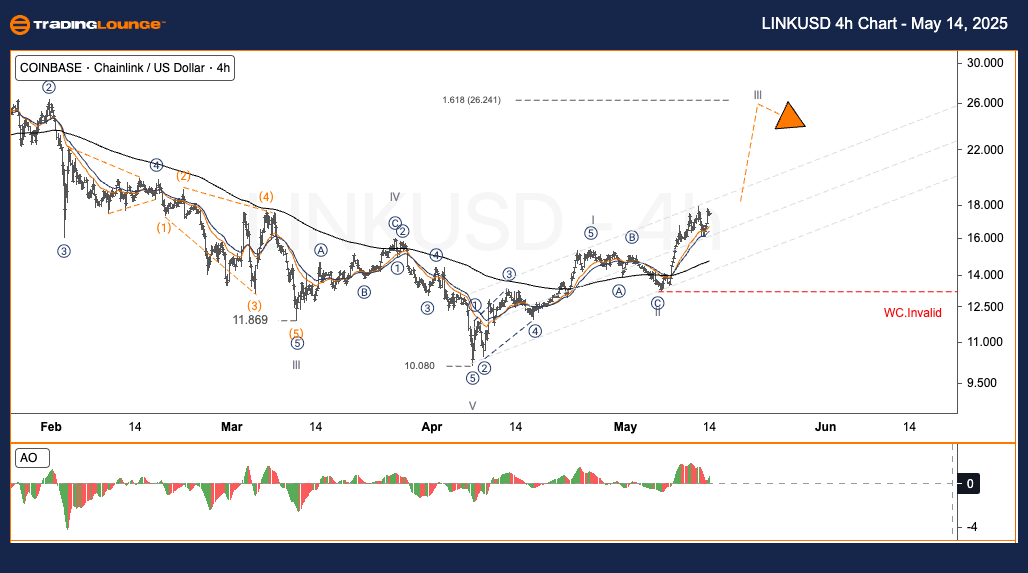
Chainlink (LINKUSD) H4 Chart Strategy – Technical Elliott Wave Forecast

LINK completed its wave II correction and has stayed above crucial support levels. This resilience suggests the potential beginning of wave III, typically the most dynamic leg in a five-wave sequence. Should wave III reach a 1.618 extension of wave I, the price target stands at $26.24. Maintaining levels above the mid-channel increases the odds of achieving this projection.

The invalidation line for the current wave structure remains firm at $13.00. A breach below this level would invalidate the Elliott count.

Trading Strategy – H4 Chart
Approach:

✅ Swing Traders:

A pullback toward the $15–$16 zone may present a strategic entry aligned with wave 2 of III.

Risk Management:

🟥 A fall beneath $13.00 marks the wave structure invalid, requiring a new wave count.

Technical Analyst: Kittiampon Somboonsod, CEWA

Source: Visit Tradinglounge.com and learn from the Experts. Join TradingLounge Here 

Previous: ETHUSD Elliott Wave Technical Analysis

VALUE Offer - Buy 1 Month & Get 3 Months!Click here

Access 7 Analysts Over 200 Markets Covered. Chat Room With Support

LINKUSD-4h-Crypto-ch...

Related

Navigate the XRP Crypto market with Confidence Price News Today and XRPUSD Elliott Wave Technical Analysis

Navigate the XRP Crypto market with Confidence Price News Today and XRPUSD Elliott Wave Technical Analysis

This article provides a detailed XRP price prediction using Elliott Wave analysis. It covers XRPUSD ...

Read More >
Cardano (ADAUSD) Elliott Wave Analysis: Price Forecast, Fibonacci Levels, Trading Strategy & Wave (III) Setup

Cardano (ADAUSD) Elliott Wave Analysis: Price Forecast, Fibonacci Levels, Trading Strategy & Wave (III) Setup

Elliott Wave technical analysis of Cardano (ADAUSD), including daily and 4-hour chart breakdowns. It...

Read More >
SOUTH32 LIMITED Stock Analysis & S32 Elliott Wave Technical Forecast with expert insights and optimize your investment strategies

SOUTH32 LIMITED Stock Analysis & S32 Elliott Wave Technical Forecast with expert insights and optimize your investment strategies

This article provides a comprehensive Elliott Wave analysis and technical forecast for ASX South32 L...

Read More >
Elliott Wave Analysis for INSURANCE AUSTRALIA GROUP LIMITED (IAG) –  Technical Outlook, Wave Structure, Price Target & Market Trends

Elliott Wave Analysis for INSURANCE AUSTRALIA GROUP LIMITED (IAG) – Technical Outlook, Wave Structure, Price Target & Market Trends

Elliott Wave analysis for ASX: IAG, outlining key market trends, wave structure, and price targets. ...

Read More >
Analysis Dives into Sun Pharma's Stock Performance: Utilizing Elliott Wave Principles to Forecast Its Trajectory

Analysis Dives into Sun Pharma's Stock Performance: Utilizing Elliott Wave Principles to Forecast Its Trajectory

This analysis dives into Sun Pharma's stock performance, utilizing Elliott Wave principles to fo...

Read More >

$1 for 2 Weeks

then $29 a month!

What a Special Offer!

Trade Recommendations

Unleash the power of deversified trading with our comprehensive portfolio, covering 250+ markets:

  • Stock Trades
  • Crypto Trades
  • Forex Trades
  • Commodity Trades
Elliott Wave Analysis

Gain a competitive edge with expert insights and AI-powered Elliott Wave charting into:

  • Global Indices
  • US Stocks & ASX Stocks
  • Forex & Crypto
  • Commodities
Top-Notch Trading Tools

Equip yourself with the tools of success:

  • Real-time Chat rooms
  • Elliott Wave Algorithm
  • Portfolio tools
  • TradingLevels
  • Screener
  • Trading Game
7 Elliott Wave Analysts

Stay ahead of the market with daily charts and insightful videos
Your secret to strategic trading!

JOIN HERE


Welcome to TradingLounge (ASIC A.R.No. 321187), specialists in trades, trading education and technical analysis, covering stocks, indices, commodities, forex and cryptocurrencies.

When you join TradingLounge you have access to everything we offer, including trade tools, educational content and a social platform to chat with like-minded investors.

Read more

@Copyright 2024 by tradinglounge.com

Contact Us

Australian no: 02 4787 6020

International no: +61 (2) 47876020

Pay with:

Find us on