Spotify Technology S.A. (SPOT) – Elliott Wave Technical Analysis
This updated technical analysis integrates Elliott Wave Theory across the daily and intraday 1-hour charts for Spotify (SPOT). It identifies key price levels, wave counts, and potential entry points in alignment with current market momentum.
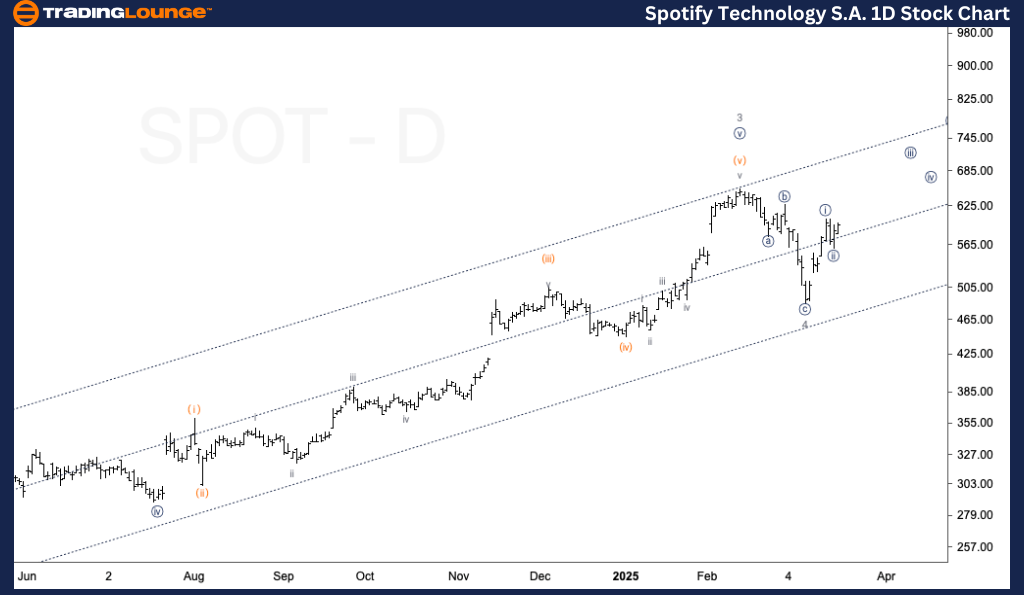
Spotify Technology S.A. (SPOT) – Elliott Wave Analysis Daily Chart
Function: Trend
Mode: Impulsive
Structure: Motive
Position: Wave 5 of (1)
Direction: Bullish
Details:
Wave 4 recently confirmed support at the key TradingLevel5 zone around $500. As long as SPOT stock holds above $650, the bullish momentum in Wave 5 could target the $800 level.
Daily Chart Outlook
Spotify stock appears to have completed Wave 4, establishing solid support near the $500 mark. Provided the price action stays above $650, further upside is likely in Wave 5, aiming toward a resistance area around $800. This aligns with the current Elliott Wave bullish structure.
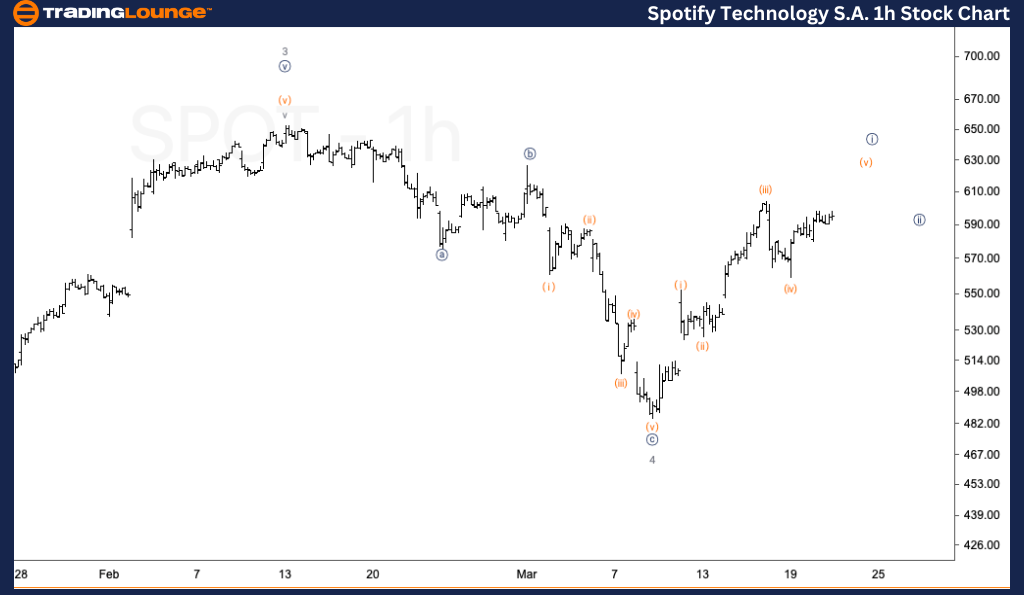
Spotify Technology S.A. (SPOT) – Elliott Wave Analysis 1-Hour Chart
Function: Trend
Mode: Impulsive
Structure: Motive
Position: Wave {i} of 5
Direction: Bullish
Details:
The alternative Elliott Wave count suggests that Wave {i} of 5 is still forming. Expect a corrective Wave {ii} to follow, offering potential short-term buying opportunities as the uptrend resumes.
1-Hour Chart Outlook
The 1-hour timeframe shows an unfolding Wave {i} within the broader Wave 5 structure. A three-wave corrective pattern in Wave {ii} is likely next. This presents a possible bullish setup for traders seeking to capture short-term price movements in SPOT stock.
Technical Analyst: Alessio Barretta
Source: Visit Tradinglounge.com and learn from the Experts. Join TradingLounge Here
Previous: QUALCOMM Inc. (QCOM) Elliott Wave Technical Analysis
VALUE Offer - Buy 1 Month & Get 3 Months!Click here
Access 7 Analysts Over 200 Markets Covered. Chat Room With Support