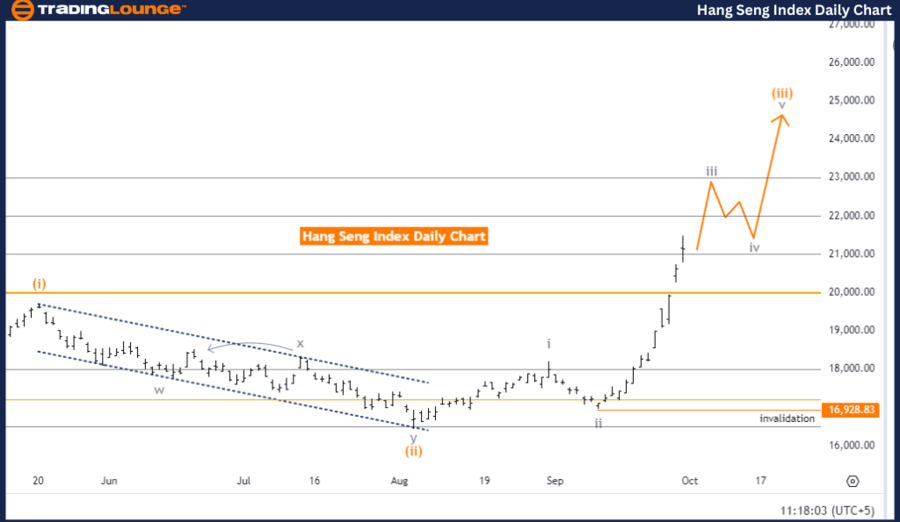
Hang Seng Index Elliott Wave Analysis - TradingLounge (Daily Chart)
FUNCTION: Trend
MODE: Impulsive
STRUCTURE: Gray Wave 3
POSITION: Orange Wave 3
DIRECTION (Next Lower Degrees): Gray Wave 4
DETAILS: Gray Wave 2 completed; Gray Wave 3 in progress
Wave Invalidation Level: 16,928.83
Hang Seng Index Elliott Wave Technical Analysis
The Hang Seng Index Elliott Wave analysis for the daily chart suggests an impulsive trend, signaling a strong directional market movement. The current structure under analysis is Gray Wave 3, which is part of the ongoing upward trend, indicating a notable market advance.
Presently, the Hang Seng Index is positioned in Orange Wave 3, in alignment with the larger degree Gray Wave 3. The recent completion of Gray Wave 2 has paved the way for Gray Wave 3 to progress, continuing the upward momentum. In Elliott Wave Theory, Wave 3 is often the most dynamic and extended wave within an impulsive sequence, meaning that the market’s upward movement is expected to strengthen further as Gray Wave 3 unfolds.
The next anticipated phase will be Gray Wave 4, which is a corrective wave typically following the completion of Wave 3. However, since Gray Wave 3 is still ongoing, the market is likely to continue its upward trend before any correction occurs. This implies that short-term upward momentum is expected to persist.
A critical level to observe is the invalidation point of 16,928.83. If the market falls below this level, the current Elliott Wave analysis will be invalidated, requiring a reassessment of the trend. This invalidation level is crucial for traders, as it confirms whether the current bullish trend remains intact.
Summary
The Hang Seng Index Elliott Wave analysis indicates that the impulsive trend, driven by Gray Wave 3, is ongoing. Traders should monitor the invalidation level of 16,928.83. As long as the market stays above this point, the upward trend remains strong. A drop below this level would suggest the need to reassess the market's direction.
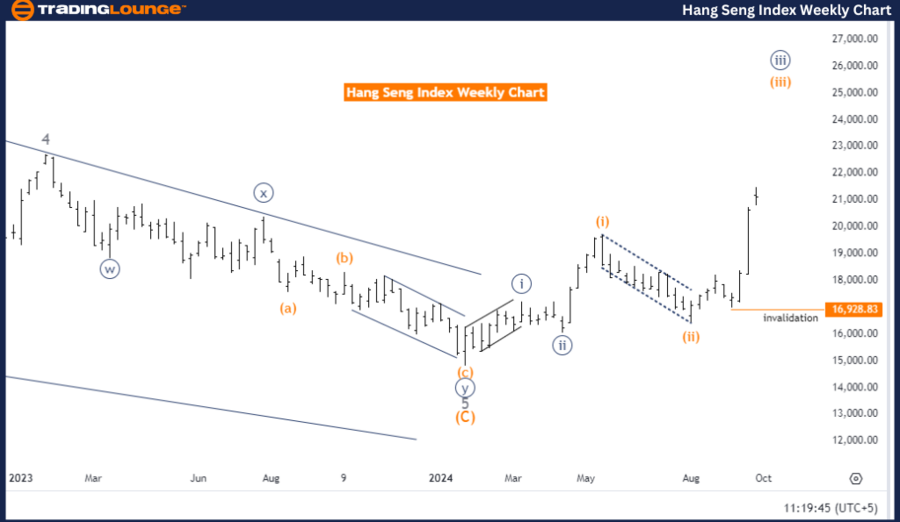
Hang Seng Index Elliott Wave Analysis (Weekly Chart)
FUNCTION: Trend
MODE: Impulsive
STRUCTURE: Orange Wave 3
POSITION: Navy Blue Wave 3
DIRECTION (Next Lower Degrees): Orange Wave 4
DETAILS: Orange Wave 2 completed; Orange Wave 3 in progress
Wave Invalidation Level: 16,928.83
The Hang Seng Index Elliott Wave analysis for the weekly chart indicates an impulsive trend, suggesting strong directional movement. The current structure being analyzed is Orange Wave 3, which is a critical part of the ongoing upward trend, signifying continued upward momentum.
Currently, the index is positioned in Navy Blue Wave 3, in line with the larger degree Orange Wave 3. The completion of Orange Wave 2 has set the stage for Orange Wave 3 to develop further. As per Elliott Wave Theory, Wave 3 is generally the most extended and powerful phase of an impulsive sequence, suggesting that the market will likely maintain its upward trajectory as Orange Wave 3 progresses.
The next expected phase is Orange Wave 4, which is typically a corrective wave that follows the completion of Wave 3. However, since Orange Wave 3 is still developing, the bullish trend is likely to persist in the near term before any correction takes place.
A key level to watch is 16,928.83, which serves as the wave invalidation point. Should the market drop below this level, the current Elliott Wave analysis would be invalidated, requiring a reassessment of the trend. This level is crucial for traders, as it confirms whether the upward trend remains intact.
Summary
The Hang Seng Index Elliott Wave analysis for the weekly chart suggests a continued impulsive trend, driven by Orange Wave 3. Traders should closely monitor the 16,928.83 invalidation level. As long as the market stays above this level, the bullish trend is expected to persist. A drop below this level would necessitate a reassessment of the market's direction.
Technical Analyst: Malik Awais
Source: visit Tradinglounge.com and learn From the Experts Join TradingLounge Here
Previous: DOW JONES - DJI Elliott Wave Technical Analysis
VALUE Offer - Buy 1 Month & Get 3 Months!Click here
Access 7 Analysts Over 200 Markets Covered. Chat Room With Support