Elliott Wave Analysis for Costco Wholesale Corp. (COST) - July 30, 2024

Welcome to our comprehensive Elliott Wave analysis for Costco Wholesale Corp. (COST) as of July 30, 2024. This analysis explores COST's price movements using Elliott Wave Theory, highlighting potential trading opportunities based on current trends and market structure. We examine both daily and 4-hour charts to provide a detailed view of COST's market dynamics.

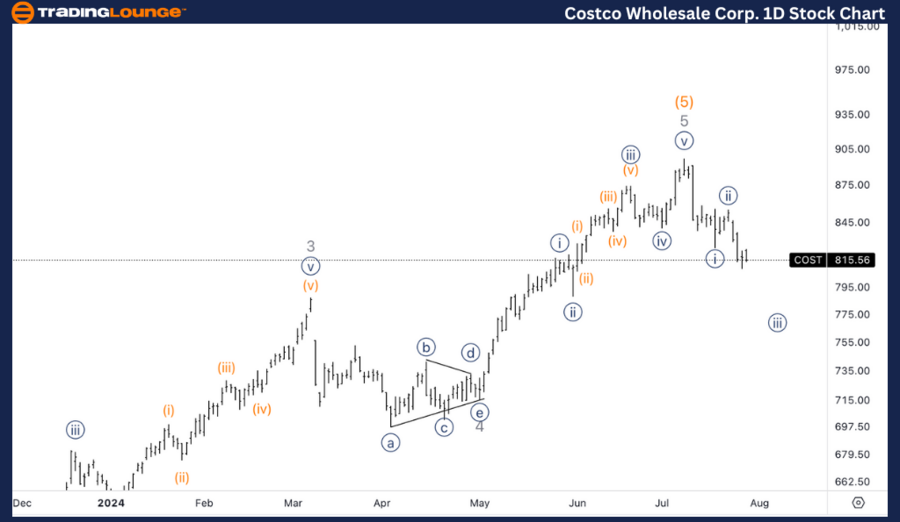
COST Elliott Wave Analysis - Daily Chart

Costco Wholesale Corp. (COST) Daily Chart Analysis

COST Elliott Wave Technical Analysis

Function: Counter Trend

Mode: Corrective

Structure: ZigZag

Position: Wave A

Direction: Downside into Wave A

We are observing the end of a significant bull run in COST. The analysis indicates a potential retracement towards the area of the previous Minor Wave 4. This suggests more downside movement is expected in the coming weeks, aligning with a corrective pattern unfolding.

COST Technical Analysis - Daily Chart

The daily chart signals that COST might have concluded a major bullish phase. The anticipated movement is downward, likely reaching the previous Minor Wave 4 area. This ongoing correction implies further declines may occur before a potential market reversal.

Costco-Wholesale-Cor...


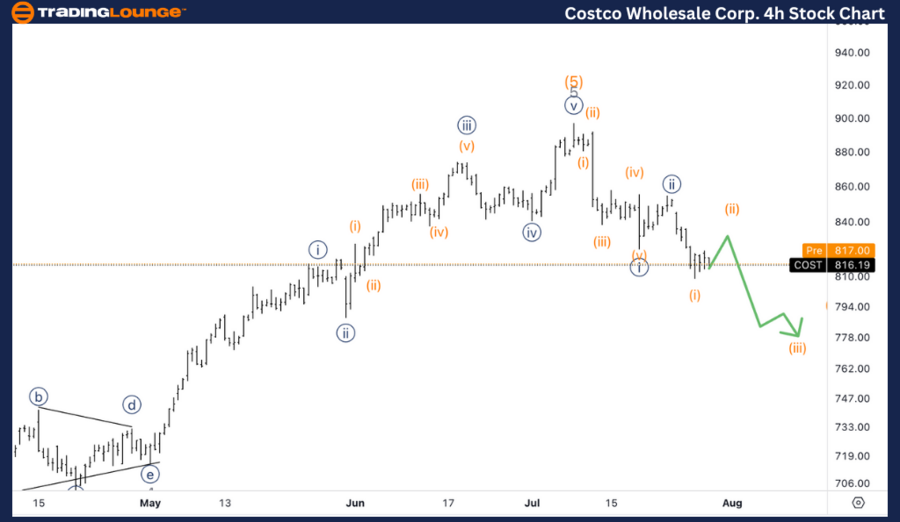
Tradinglounge COST Elliott Wave Analysis - 4H Chart

Costco Wholesale Corp. (COST) 4H Chart Analysis

COST Elliott Wave Technical Analysis

Function: Counter Trend

Mode: Corrective

Structure: ZigZag

Position: Wave {iii} of A

Direction: Downside in Wave {iii}

The 4-hour chart presents a clear five-wave pattern leading into wave {i}, followed by a corrective phase and a continuation downward into wave {iii}. This pattern suggests the movement is part of a larger corrective phase. Even if a short-term three-wave correction occurs, the overall trend remains downward.

Technical Analyst: Alessio Barretta

Source: visit Tradinglounge.com and learn From the Experts Join TradingLounge Here 

See Previous: JP Morgan & Chase Co. (JPM) Elliott Wave Technical Analysis

Special Trial Offer - 0.76 Cents a Day for 3 Months! Click here

Access 7 Analysts Over 170 Markets Covered. Chat Room With Support

Costco-Wholesale-Cor...

Related

Ethereum/U.S. dollar(ETHUSD) Elliott Wave Technical Analysis 27 October 23

Ethereum/U.S. dollar(ETHUSD) Elliott Wave Technical Analysis 27 October 23

Ethereum/U.S. dollar(ETHUSD) Elliott Wave Technical Analysis for 27 October 23 with 4-hour and daily...

Read More >
U.S. Dollar / Japanese Yen Elliott Wave Technical Analysis: Perfect for Forex Traders Seeking Insights into USDJPY Price Movements

U.S. Dollar / Japanese Yen Elliott Wave Technical Analysis: Perfect for Forex Traders Seeking Insights into USDJPY Price Movements

Discover the latest USDJPY Elliott Wave analysis focusing on daily and 4-hour charts. This comprehen...

Read More >
Gold (XAUUSD) Commodity Elliott Wave Technical Analysis: A Minor Pullback is Expected soon, Bullish Trend Continues

Gold (XAUUSD) Commodity Elliott Wave Technical Analysis: A Minor Pullback is Expected soon, Bullish Trend Continues

Gold's Elliott Wave analysis reveals a strong upward momentum throughout 2024, with prices neari...

Read More >
DAX Elliott Wave Analysis: Explore Germany's Stock Market Trends, Bullish Forecasts, and Trading Strategies for 2025

DAX Elliott Wave Analysis: Explore Germany's Stock Market Trends, Bullish Forecasts, and Trading Strategies for 2025

DAX (Germany) Elliott Wave Analysis, highlighting key trends and forecasts for 2025. This analysis f...

Read More >
Indian Stock Market Update on OIL & NATURAL Gas Co. Stock Analysis: ONGC Elliott Wave Technical Analysis & Price Prediction

Indian Stock Market Update on OIL & NATURAL Gas Co. Stock Analysis: ONGC Elliott Wave Technical Analysis & Price Prediction

Discover comprehensive ONGC stock analysis featuring Elliott Wave forecasts, technical analysis, and...

Read More >
Theta token/ U.S. dollar(THETAUSD) Elliott Wave Technical Analysis 12 December 23

Theta token/ U.S. dollar(THETAUSD) Elliott Wave Technical Analysis 12 December 23

TradingLounge Day and 4H Chart of Theta token/ U.S. dollar(THETAUSD) Elliott Wave Technical Analysis...

Read More >

$1 for 2 Weeks

then $29 a month!

What a Special Offer!

Trade Recommendations

Unleash the power of deversified trading with our comprehensive portfolio, covering 250+ markets:

  • Stock Trades
  • Crypto Trades
  • Forex Trades
  • Commodity Trades
Elliott Wave Analysis

Gain a competitive edge with expert insights and AI-powered Elliott Wave charting into:

  • Global Indices
  • US Stocks & ASX Stocks
  • Forex & Crypto
  • Commodities
Top-Notch Trading Tools

Equip yourself with the tools of success:

  • Real-time Chat rooms
  • Elliott Wave Algorithm
  • Portfolio tools
  • TradingLevels
  • Screener
  • Trading Game
7 Elliott Wave Analysts

Stay ahead of the market with daily charts and insightful videos
Your secret to strategic trading!

JOIN HERE


Welcome to TradingLounge (ASIC A.R.No. 321187), specialists in trades, trading education and technical analysis, covering stocks, indices, commodities, forex and cryptocurrencies.

When you join TradingLounge you have access to everything we offer, including trade tools, educational content and a social platform to chat with like-minded investors.

Read more

@Copyright 2024 by tradinglounge.com

Contact Us

Australian no: 02 4787 6020

International no: +61 (2) 47876020

Pay with:

Find us on