Gold (XAUUSD) Commodity Elliott Wave Technical Analysis

Gold Elliott Wave Technical Analysis

Gold continues to maintain its strong upward momentum in 2024, nearing another high in just over three weeks. The precious metal has gained over 23% year-to-date, now testing levels close to a new all-time high. Despite this bullish trend, a minor pullback is expected in the near term.

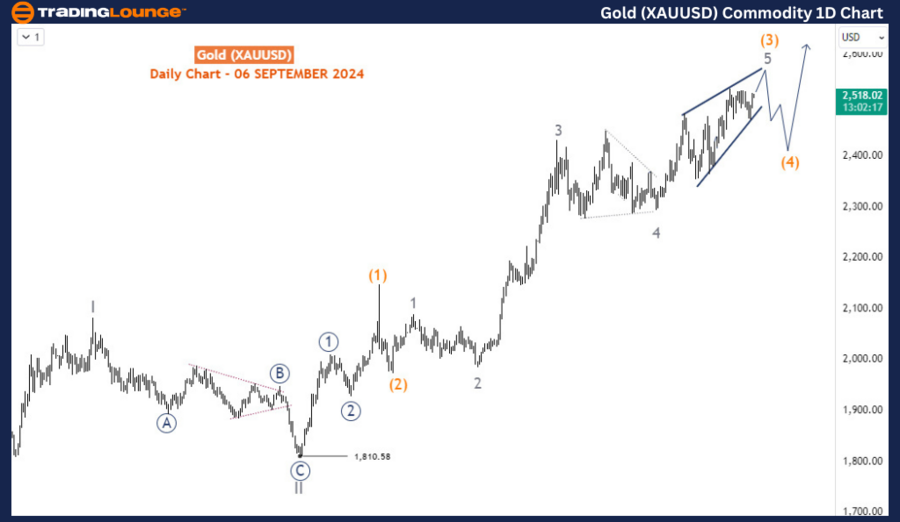
Gold (XAUUSD) Daily Chart Analysis

On the daily chart, Gold has followed a long-term bullish trend since December 2015. Based on Elliott Wave analysis, the supercycle wave (IV) of this larger uptrend was recently completed, setting the stage for a new impulsive move in wave (V). Within wave (V), waves I and II completed in May and October 2023, respectively. Currently, Gold is advancing within wave (3) of 3 (circled) of wave III, which may extend beyond the 2550 level before reaching its peak.

The consolidation phase seen between April 12 and June 26 aligns with wave 4 of (3), acting as a corrective structure in the broader trend. The ongoing upward movement appears to form an ending diagonal structure for wave 5 of (3). If this diagonal holds, Gold is poised to break previous highs and reach a new peak. However, if the structure fails, a correction in wave (4) may follow. This wave (4) correction would offer the market a chance to absorb recent gains before potentially resuming the uptrend.

Gold-XAUUSD-Commodit...


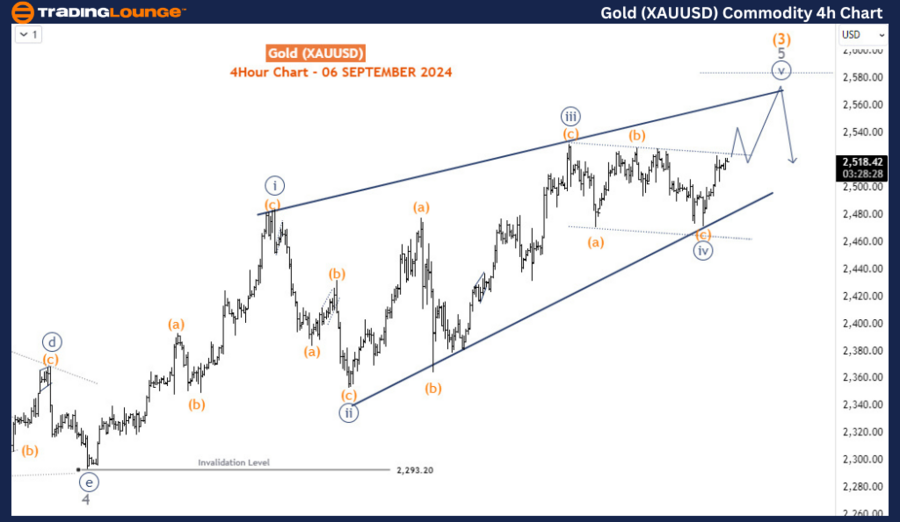
Gold (XAUUSD) H4 Chart Analysis

On the H4 chart, price action is progressing within wave v (circled) of 5 of (3), following the completion of a flat structure for wave iv (circled). While minor pullbacks have occurred, as long as the price stays above 2472, further rallies are anticipated. For short-term traders, these small dips could serve as entry opportunities as Gold targets new highs.

In the medium term, the completion of wave (3) is approaching, with an expected pullback for wave (4). This pullback could act as a healthy correction, giving the market time to regroup before wave (V) resumes. Traders should prepare for potential reversals as wave (3) concludes and wave (4) begins, marking a crucial point in Gold's multi-year bullish cycle.

This analysis indicates that although Gold shows continued strength, the Elliott Wave structure points to an imminent correction before the broader uptrend resumes.

Technical Analyst: Sanmi Adeagbo

Source: visit Tradinglounge.com and learn From the Experts Join TradingLounge Here 

See Previous: Cocoa Elliott Wave Technical Analysis

Special Trial Offer - 0.76 Cents a Day for 3 Months! Click here

Access 7 Analysts Over 200 Markets Covered. Chat Room With Support

Gold-XAUUSD-Commodit...

Related

Russell 2000 Index Elliott Wave Analysis Shows Strong Bullish Trend Setup with Indicating Early Momentum in a Long-term Upward Trend

Russell 2000 Index Elliott Wave Analysis Shows Strong Bullish Trend Setup with Indicating Early Momentum in a Long-term Upward Trend

This analysis reveals a bullish Elliott Wave structure in the Russell 2000 index, indicating early m...

Read More >
Silver Has Gained 12% Since Late January Maintaining a Bullish Outlook - XAGUSD Commodities Elliott wave Technical analysis

Silver Has Gained 12% Since Late January Maintaining a Bullish Outlook - XAGUSD Commodities Elliott wave Technical analysis

Silver has gained 12% since late January, retracing its five-wave impulse sequence while maintaining...

Read More >
British Pound/ Australian Dollar(GBPAUD) Elliott Wave Technical Analysis 8 November 23

British Pound/ Australian Dollar(GBPAUD) Elliott Wave Technical Analysis 8 November 23

GBPAUD Elliott Wave Analysis Trading Lounge Day and 4-hour Chart for 8 November 23, delves into the ...

Read More >
Dogecoin (DOGEUSD) Elliott Wave Technical Analysis – Price Prediction, Trading Strategy, Support & Resistance Levels

Dogecoin (DOGEUSD) Elliott Wave Technical Analysis – Price Prediction, Trading Strategy, Support & Resistance Levels

Dogecoin (DOGEUSD) Elliott Wave analysis provides a detailed look at the current price trends, marke...

Read More >
USDCHF Elliott Wave Analysis: Bullish Trends, Wave Counts, Chart Insights, and Key Invalidation Levels Explained

USDCHF Elliott Wave Analysis: Bullish Trends, Wave Counts, Chart Insights, and Key Invalidation Levels Explained

The USDCHF Elliott Wave analysis indicates a bullish trend supported by impulsive wave structures on...

Read More >
Cocoa Elliott Wave Technical Analysis: Breaking into New Highs Signals Strong Bullish Momentum

Cocoa Elliott Wave Technical Analysis: Breaking into New Highs Signals Strong Bullish Momentum

Cocoa's price action reflects a strong bullish sentiment, supported by analyses across daily and...

Read More >

Buy 1 Month

Get 3 Months!

Special Offer:

Trade Recommendations

Unleash the power of deversified trading with our comprehensive portfolio, covering:

  • Stock Trades
  • Crypto Trades
  • Forex Trades
  • Commodity Trades
Elliott Wave Analysis

Gain a competive edge with expert insights in to:

  • Global Indices
  • US Stocks & ASX Stocks
  • Forex & Crypto
  • Commodities
Top-Notch Trading Tools

Equip yourself with the tools of success:

  • Social Chat
  • Elliott Wave Algorithm
  • Screener
  • TradingLevels
  • Trading Game
7 Elliott Wave Analysts

Stay ahead of the market with daily charts and insightful videos
-Your secret to strategic trading!

JOIN HERE


Welcome to TradingLounge (ASIC A.R.No. 321187), specialists in trades, trading education and technical analysis, covering stocks, indices, commodities, forex and cryptocurrencies.

When you join TradingLounge you have access to everything we offer, including trade tools, educational content and a social platform to chat with like-minded investors.

Read more

@Copyright 2024 by tradinglounge.com

Contact Us

Australian no: 02 4787 6020

International no: +61 (2) 47876020

Pay with:

Find us on