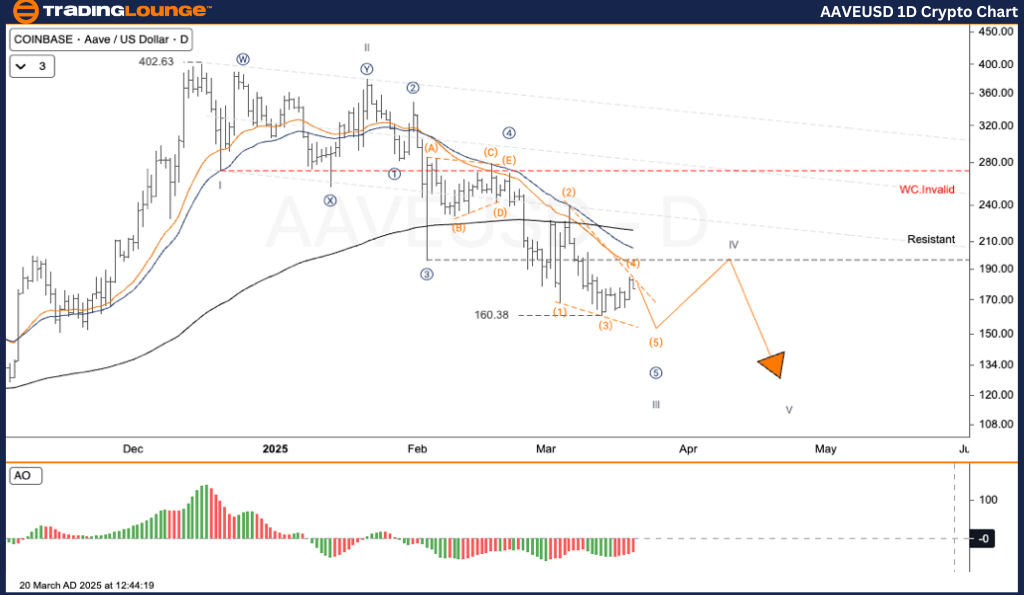
AAVE/USD (AAVEUSD) Elliott Wave Analysis – TradingLounge Daily Chart
AAVEUSD Elliott Wave Technical Analysis
Function: Trend Following
Mode: Motive
Structure: Impulse
Position: Wave III
Next Higher Degree Direction: Downtrend Continuation
Wave Cancellation Level: Not Specified
Analysis Details:
AAVE is experiencing a downward correction after peaking at $399. The ongoing wave structure indicates a progressive decline, adhering to the classic (1)-(2)-(3)-(4)-(5) impulse pattern.
AAVE/USD Trading Strategy
AAVE/USD remains in a strong downtrend, with the current wave IV acting as a temporary recovery before the final wave V decline. Unless the price breaks resistance, it is expected to test levels below $140.
- Invalidation Level: A price breakout above $280 would require structural reassessment.
Trading Strategies:
For Short-Term Traders (Swing Trading):
✅ Enter sell positions when the price approaches the $180 – $200 range and exhibits reversal signals.
Risk Management:
If the price exceeds $280, the Elliott Wave structure is invalid and needs reevaluation.
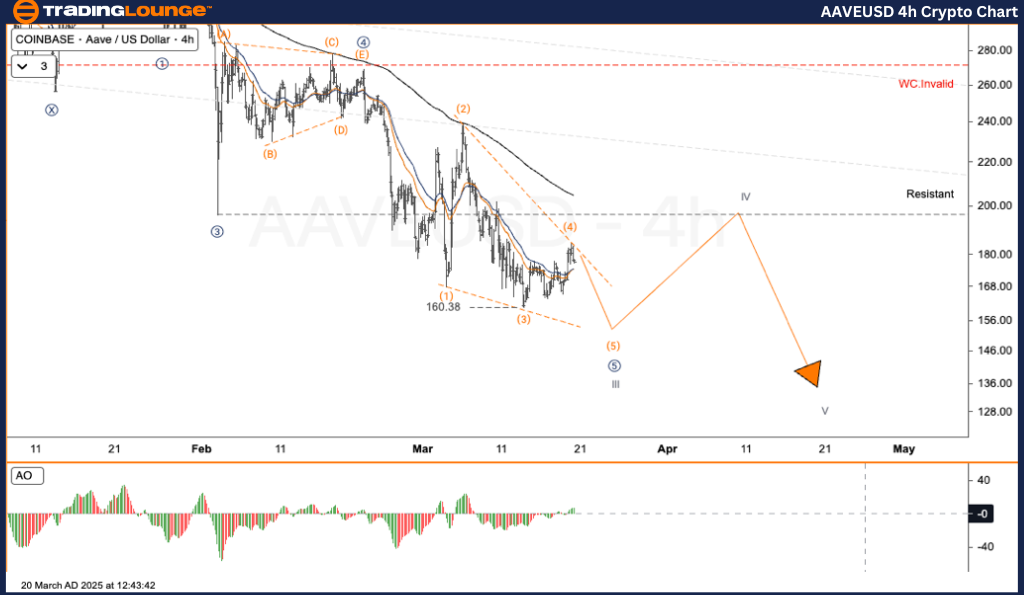
AAVE/USD (AAVEUSD) Elliott Wave Analysis – TradingLounge H4 Chart
AAVEUSD Elliott Wave Technical Analysis
Function: Trend Following
Mode: Motive
Structure: Impulse
Position: Wave III
Next Higher Degree Direction: Downtrend Continuation
Wave Cancellation Level: Not Specified
Analysis Details:
AAVE continues its downward movement after reaching a $399 high. The Elliott Wave pattern confirms a well-defined five-wave impulse sequence (1)-(2)-(3)-(4)-(5), supporting the downtrend.
AAVE/USD Trading Strategy
AAVE/USD remains in a bearish trend, with wave IV acting as a short-term pullback before the final wave V downturn. If the price remains under key resistance levels, it will likely test support below $140.
- Invalidation Level: A breakout above $280 would signal the need for wave structure reassessment.
Trading Strategies:
For Short-Term Traders (Swing Trading):
✅ Consider selling when the price nears the $180 – $200 zone and exhibits a clear reversal.
Risk Management:
A move above $280 suggests the need for structural reanalysis.
Technical Analyst: Kittiampon Somboonsod
Source: Visit Tradinglounge.com and learn from the Experts. Join TradingLounge Here
Previous: BTCUSD Elliott Wave Technical Analysis
VALUE Offer - Buy 1 Month & Get 3 Months!Click here
Access 7 Analysts Over 200 Markets Covered. Chat Room With Support