Cocoa Elliott wave analysis - bullish trend persists.

In the dynamic world of commodities, the cocoa market is currently displaying a resilient bullish trend, according to our in-depth Elliott Wave technical analysis as of February 24, 2024. Employing the Elliott Wave theory, we delve into the intricate patterns and structures governing cocoa's price movements, focusing on the ongoing impulse wave that has persisted since the pivotal breakout at 2198. This breakout marked the end of a 23-week triangle range, setting the stage for a compelling bullish trajectory.

Cocoa Elliott Wave technical analysis

Daily Time Frame Analysis:

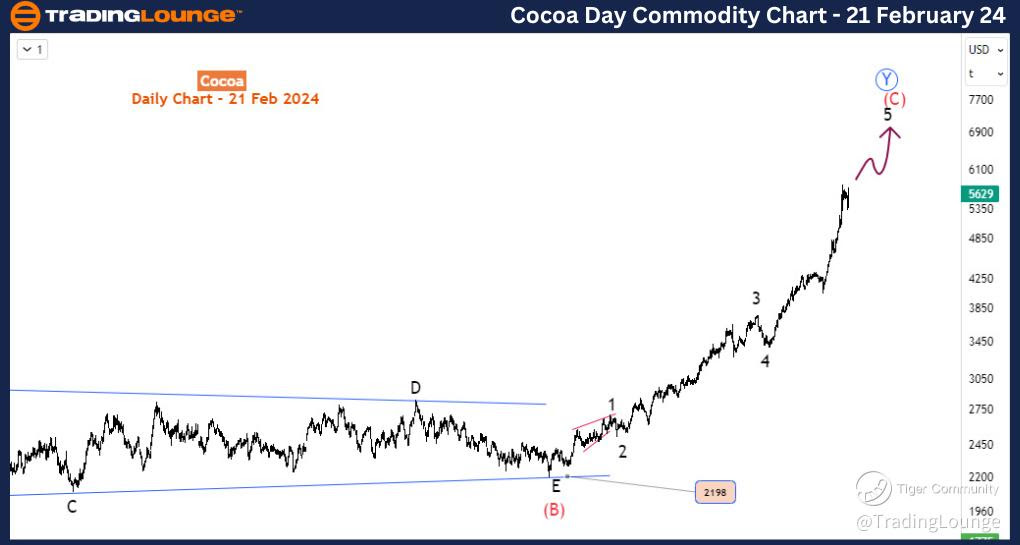
On the daily time frame, our analysis pinpoints a robust structure within the ongoing impulse wave, denoted as the black wave. This wave is anticipated to reach its culmination in the expansive red wave (C), unfolding within the larger context of the blue wave Y. The breakout at 2198 serves as the origin point for this impressive wave sequence. With this framework in mind, we foresee a sustained upward movement, projecting a rally that could potentially propel cocoa prices toward the 7000 level.

It is crucial to note that our observation indicates that the current impulse wave is approaching its final phase, identified as black wave 5. This implies that despite the upward momentum, traders should remain vigilant for potential shifts in market sentiment as the wave nears completion.

Cocoa-Day-Commodity-...


4-Hour Time Frame Analysis:

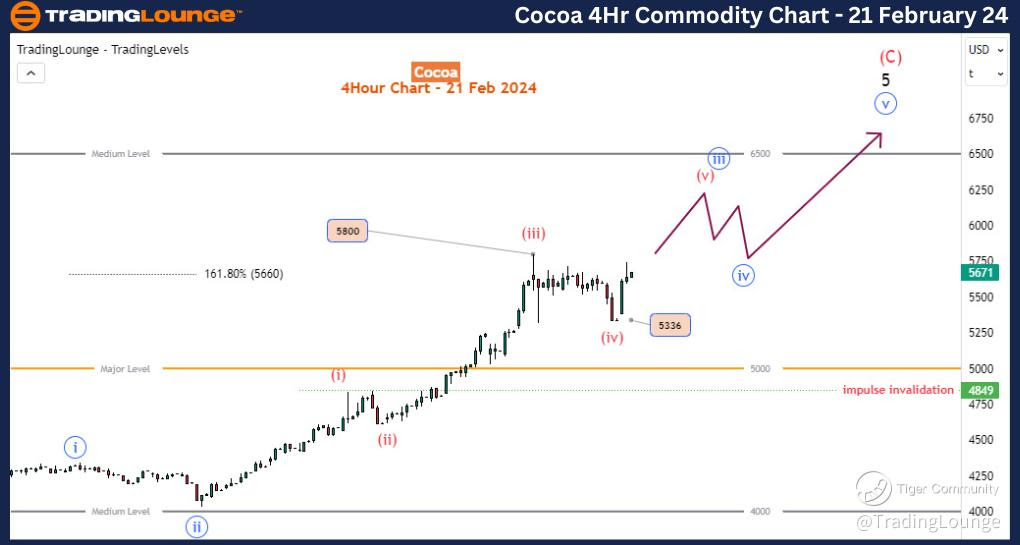
Zooming in on the 4-hour time frame, we closely examine the internal sub-waves constituting the ongoing wave 5, with a specific focus on the progression within the blue sub-wave iii of 5. Our analysis indicates that the market is currently traversing the internal waves of the blue wave iii. Notably, the completion of red sub-wave iv within blue iii occurred around the 5336 mark, poised to surpass the preceding peak of red sub-wave (iii) at 5800.

This impending breakout sets the stage for a fresh bullish momentum, steering the price action towards the 6500 threshold to complete the blue wave iii. Further upward extension is envisioned to finalize black wave 5. This analysis positions traders to anticipate potential entry points and capitalize on the unfolding bullish opportunities.

Technical Analyst: Sanmi Adeagbo

Source: visit Tradinglounge.com and learn From the Experts Join TradingLounge Here 

See Previous: Gold (XAUUSD)

Cocoa-4h-Commodity-C...


Conclusion:

In conclusion, our Elliott Wave analysis strongly suggests that the current upward momentum in cocoa prices remains intact. The impending breakout on the 4-hour chart signals the potential for further gains for cocoa buyers. As the market navigates the final phases of the black wave 5, traders should exercise caution and remain attuned to potential shifts in market dynamics. The projected rally toward the 7000 level aligns with a bullish trajectory, presenting lucrative opportunities for traders to capitalize on the prevailing market sentiment.

For investors and traders alike, staying informed about these Elliott Wave patterns provides a strategic advantage in navigating the cocoa commodity market. As always, it is essential to combine technical analysis with a comprehensive understanding of market dynamics to make well-informed and profitable decisions.

Related

Comprehensive Corn Price Analysis: Corn Commodity Elliott Wave Forecast and Technical Insights into Current Corn Futures Market Trends

Comprehensive Corn Price Analysis: Corn Commodity Elliott Wave Forecast and Technical Insights into Current Corn Futures Market Trends

This article provides an in-depth analysis of corn prices through the lens of Elliott Wave theory. I...

Read More >
Watch The Ongoing Developments in Hero MotoCorp’s Share Price: HERO Stocks Elliott Wave Technical Analysis

Watch The Ongoing Developments in Hero MotoCorp’s Share Price: HERO Stocks Elliott Wave Technical Analysis

Explore the latest Hero MotoCorp stock analysis using Elliott Wave theory and technical indicators. ...

Read More >
 British Pound / U.S. Dollar (GBPUSD) Elliott Wave Breakdown: Daily Wave 5 Bullish Momentum and 4‑Hour Wave 2 Correction

British Pound / U.S. Dollar (GBPUSD) Elliott Wave Breakdown: Daily Wave 5 Bullish Momentum and 4‑Hour Wave 2 Correction

GBPUSD Elliott Wave analysis showing a bullish impulse (Wave 5) on the daily chart and a corrective...

Read More >
KOSPI Composite Elliott Wave Analysis: Market Forecast, Key Support at 2,438.17, Trading Strategy & Price Prediction

KOSPI Composite Elliott Wave Analysis: Market Forecast, Key Support at 2,438.17, Trading Strategy & Price Prediction

The KOSPI Composite Elliott Wave Analysis indicates a bullish trend, with the market currently in Or...

Read More >
Uniswap Crypto Price News Today: UNIUSD Elliott Wave Technical Analysis, Price Prediction, and Trading Insights

Uniswap Crypto Price News Today: UNIUSD Elliott Wave Technical Analysis, Price Prediction, and Trading Insights

This article provides an in-depth Elliott Wave analysis of Uniswap (UNIUSD), focusing on key technic...

Read More >
Soybean Commodity Elliott Wave Technical Analysis: Ongoing Bearish Trend, Potential Price Movements, and Strategic Insights

Soybean Commodity Elliott Wave Technical Analysis: Ongoing Bearish Trend, Potential Price Movements, and Strategic Insights

Discover in-depth soybean price analysis with a focus on Elliott Wave theory. This analysis covers t...

Read More >

$1 for 2 Weeks

then $29 a month!

What a Special Offer!

Trade Recommendations

Unleash the power of deversified trading with our comprehensive portfolio, covering 250+ markets:

  • Stock Trades
  • Crypto Trades
  • Forex Trades
  • Commodity Trades
Elliott Wave Analysis

Gain a competitive edge with expert insights and AI-powered Elliott Wave charting into:

  • Global Indices
  • US Stocks & ASX Stocks
  • Forex & Crypto
  • Commodities
Top-Notch Trading Tools

Equip yourself with the tools of success:

  • Real-time Chat rooms
  • Elliott Wave Algorithm
  • Portfolio tools
  • TradingLevels
  • Screener
  • Trading Game
7 Elliott Wave Analysts

Stay ahead of the market with daily charts and insightful videos
Your secret to strategic trading!

JOIN HERE


Welcome to TradingLounge (ASIC A.R.No. 321187), specialists in trades, trading education and technical analysis, covering stocks, indices, commodities, forex and cryptocurrencies.

When you join TradingLounge you have access to everything we offer, including trade tools, educational content and a social platform to chat with like-minded investors.

Read more

@Copyright 2024 by tradinglounge.com

Contact Us

Australian no: 02 4787 6020

International no: +61 (2) 47876020

Pay with:

Find us on