16Jul

Vechain (VETUSD) Elliott Wave Analysis with Price Prediction, Fibonacci Targets, and Swing Trading Strategy for Bullish Wave 3 Setup

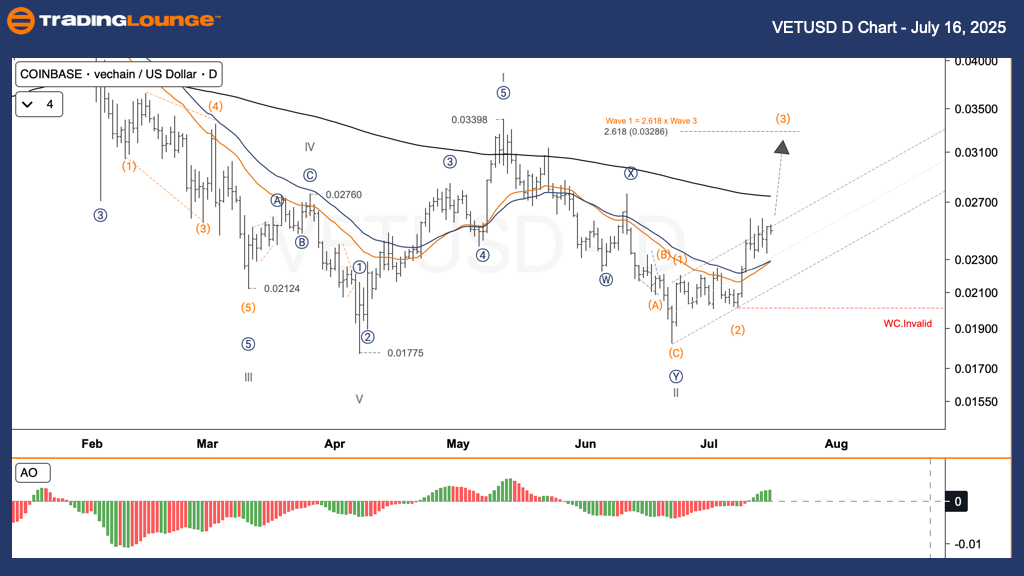
Vechain (VETUSD) – Elliott Wave Analysis Technical Analysis – TradingLounge Daily Chart

VETUSD Elliott Wave Forecast

Function: Follow-Trend

Mode: Motive

Structure: Impulse

Position: Wave 3

Invalidation Level: $0.02000 (Wave Count Invalidation)

Overview:
Vechain (VETUSD) is currently in sub-wave (3) of the broader wave III sequence, having concluded corrective wave II. The price target for sub-wave (3) aligns near the 2.618 Fibonacci extension of wave (1), which sits close to $0.03286 USD. To preserve the bullish Elliott Wave structure, VETUSD must trade above the critical support of $0.02000 USD. A breakdown below this level would invalidate the existing wave interpretation.

Trading Strategy:
Swing Trade Strategy (Short-Term Outlook):
If wave (4) consolidation develops, it can offer favorable conditions for scaling into long positions.

🟥 Invalidation Alert (Wave Cancel Level):
Support to Watch: $0.02000 USD
A decisive close below this level nullifies the current bullish scenario.

VETUSD-D-CRYPTO-CHAR...


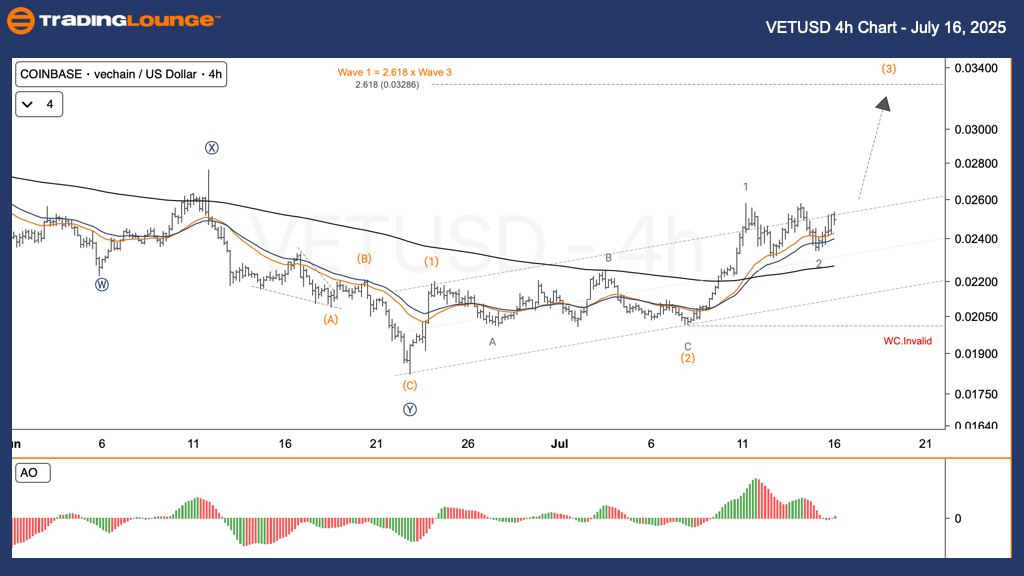
Vechain (VETUSD) – Elliott Wave Analysis – 4-Hour Chart Technical Analysis – TradingLounge

Function: Follow-Trend

Mode: Motive

Structure: Impulse

Position: Wave 3

Invalidation Level: $0.02000 (Wave Count Invalidation)

Overview:
On the 4-hour chart, VETUSD extends within sub-wave (3) of major wave III, following the confirmed completion of wave II. The near-term bullish target remains at approximately $0.03286 USD, coinciding with the 2.618 Fibonacci extension of wave (1). As long as the price sustains above $0.02000 USD, the bullish count stays intact.

Trading Strategy:
✅ Swing Trade Potential:

Look for minor pullbacks such as wave (4) to establish or add to long positions during trend continuation.

🟥 Wave Count Invalidation:
Key Support
: $0.02000 USD
A drop below this support level cancels the current wave structure.

Technical Analyst: Kittiampon Somboonsod, CEWA

Source: Visit Tradinglounge.com and learn from the Experts. Join TradingLounge Here

Previous: BTCUSD Elliott Wave Technical Analysis

VALUE Offer - Buy 1 Month & Get 3 Months!Click here

Access 7 Analysts Over 200 Markets Covered. Chat Room With Support

VETUSD-4H-CRYPTO-CHA...

Related

EURUSD Daily and 4-hour Charts: Euro/U.S.Dollar (EURUSD) Forex Elliott Wave Technical Analysis

EURUSD Daily and 4-hour Charts: Euro/U.S.Dollar (EURUSD) Forex Elliott Wave Technical Analysis

This article provides an in-depth EURUSD Elliott Wave analysis, focusing on current trends, forecast...

Read More >
NIKKEI 225(N225) Indices Elliott Wave Technical Analysis: Breaks down both daily and weekly market movements

NIKKEI 225(N225) Indices Elliott Wave Technical Analysis: Breaks down both daily and weekly market movements

This detailed analysis of the NIKKEI 225 index through the lens of Elliott Wave theory breaks down b...

Read More >
Elliott Wave Technical Analysis for Caterpillar (CAT) US Stock: Wave iv Completion Near Support, Targeting $380 Upside Momentum

Elliott Wave Technical Analysis for Caterpillar (CAT) US Stock: Wave iv Completion Near Support, Targeting $380 Upside Momentum

Detailed Elliott Wave breakdown for Caterpillar (CAT): wave (iv) completion, support at $350, projec...

Read More >
Dow Jones Forecast Using Elliott Wave: Bullish Trend Confirmed with Impulse Wave Signals on Daily and Weekly DJI Charts

Dow Jones Forecast Using Elliott Wave: Bullish Trend Confirmed with Impulse Wave Signals on Daily and Weekly DJI Charts

This Dow Jones Elliott Wave analysis outlines a bullish outlook with impulsive wave structures, conf...

Read More >
In-Depth Elliott Wave Analysis of Newmont Corporation (ASX:NEM): Identifying Wave 3 Targets and Strategic Trading Opportunities

In-Depth Elliott Wave Analysis of Newmont Corporation (ASX:NEM): Identifying Wave 3 Targets and Strategic Trading Opportunities

This article provides an in-depth Elliott Wave technical analysis of Newmont Corporation (ASX: NEM),...

Read More >
HDFC Life Insurance’s Stocks Forecast  And Elliott Wave Technical Analysis - Price Movements and Projected Resistance Levels

HDFC Life Insurance’s Stocks Forecast And Elliott Wave Technical Analysis - Price Movements and Projected Resistance Levels

This in-depth analysis covers HDFC Life Insurance’s stock forecast using Elliott Wave theory, highl...

Read More >

$1 for 2 Weeks

then $29 a month!

What a Special Offer!

Trade Recommendations

Unleash the power of deversified trading with our comprehensive portfolio, covering 250+ markets:

  • Stock Trades
  • Crypto Trades
  • Forex Trades
  • Commodity Trades
Elliott Wave Analysis

Gain a competitive edge with expert insights and AI-powered Elliott Wave charting into:

  • Global Indices
  • US Stocks & ASX Stocks
  • Forex & Crypto
  • Commodities
Top-Notch Trading Tools

Equip yourself with the tools of success:

  • Real-time Chat rooms
  • Elliott Wave Algorithm
  • Portfolio tools
  • TradingLevels
  • Screener
  • Trading Game
7 Elliott Wave Analysts

Stay ahead of the market with daily charts and insightful videos
Your secret to strategic trading!

JOIN HERE


Welcome to TradingLounge (ASIC A.R.No. 321187), specialists in trades, trading education and technical analysis, covering stocks, indices, commodities, forex and cryptocurrencies.

When you join TradingLounge you have access to everything we offer, including trade tools, educational content and a social platform to chat with like-minded investors.

Read more

@Copyright 2024 by tradinglounge.com

Contact Us

Australian no: 02 4787 6020

International no: +61 (2) 47876020

Pay with:

Find us on