Elliott Wave Analysis TradingLounge Daily Chart, 6 March 24,
In this Elliott Wave analysis for NEO/USD, we'll delve into the technical aspects of the market to identify potential trading opportunities. By understanding the current wave structure and utilizing technical indicators, traders can make informed decisions to capitalize on price movements.
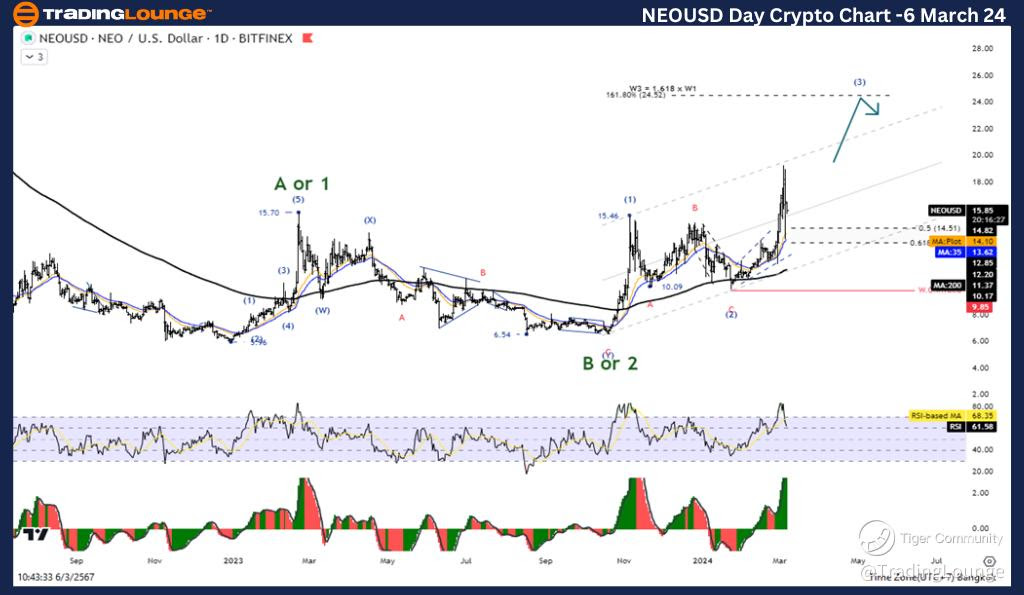
Neo/ U.S. dollar(NEOUSD) Day Chart Analysis
NEOUSD Elliott Wave Technical Analysis
Function: Follow Trend
Mode: Motive
Structure: Impulse
Position: Wave (3)
Direction Next higher Degrees: Wave ((3)) of Impulse
Wave Cancel invalid Level: 9.85
Details: Wave (3) is Equal to 161.8% of Wave (1) at 24.52
On the daily chart, NEO/USD is exhibiting an impulse wave structure, with Wave (3) currently in progress. This wave is expected to continue the uptrend, with a target price of 24.52, representing a 161.8% extension of Wave (1). The wave cancels invalid level is set at 9.85, indicating that the bullish outlook remains intact as long as prices remain above this level.
Neo/ U.S. dollar(NEOUSD)Trading Strategy:
Based on the Elliott Wave analysis, NEO/USD is anticipated to maintain its upward trajectory. Traders can consider long positions, targeting the 24.52 level as Wave (3) unfolds. It's important to monitor price action closely and adjust positions accordingly to capitalize on potential gains.
Neo/ U.S. dollar(NEOUSD)Technical Indicators:
The price of NEO/USD is currently above the 200-day moving average (MA200), indicating a strong uptrend. Additionally, the Wave Oscillator is showing bullish momentum, further supporting the bullish outlook for the cryptocurrency pair.
Elliott Wave Analysis TradingLounge 4Hr Chart, 6 March 24,
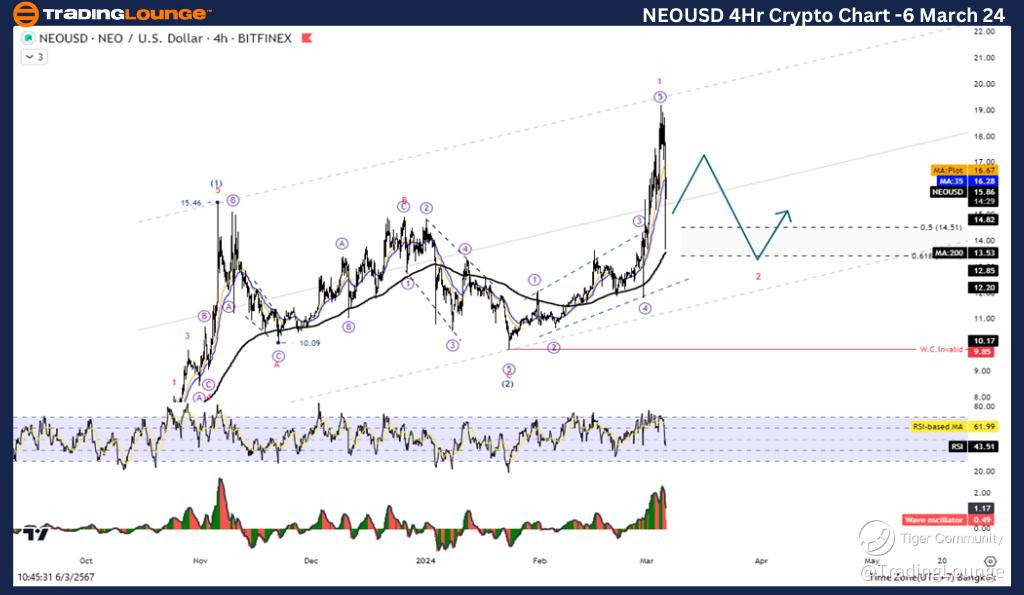
Neo/ U.S. dollar(NEOUSD) 4Hr Chart Analysis
NEOUSD Elliott Wave Technical Analysis
Function: Follow Trend
Mode: Motive
Structure: Impulse
Position: Wave (3)
Direction Next higher Degrees: Wave ((3)) of Impulse
Wave Cancel invalid Level: 9.85
Details: Wave (3) is Equal to 161.8% of Wave (1) at 24.52
On the 4-hour chart, NEO/USD continues to exhibit the impulse wave structure, with Wave (3) in progress. While Wave 1 of this impulse wave has already been completed, sub-Wave 3 is currently unfolding. As the price approaches the 161.8% extension level of Wave 1, a period of correction may occur before the uptrend resumes.
Neo/ U.S. dollar(NEOUSD)Trading Strategy:
Neo is still in an uptrend. In the structure of the surge in Wave 3, we expect it to test the 161.8% level of Wave 1, but even so, Wave 1, sub-Wave 3, is already complete. The price is entering a period of correction before rising again. A temporary pullback or consolidation phase may occur before the uptrend resumes. Utilizing proper risk management techniques, traders can capitalize on potential buying opportunities during corrective phases.
Neo/ U.S. dollar(NEOUSD)Technical Indicators:
Similar to the daily chart, the 4-hour chart also indicates a bullish bias for NEO/USD. The price remains above the MA200, The price is above the MA200 indicating an Uptrend, Wave Oscillator is a bullish Momentum.
Technical Analyst: Kittiampon Somboonsod, CEWA
Source: visit Tradinglounge.com and learn From the Experts Join TradingLounge Here
See Previous: Bitcoin/ U.S. dollar(BTCUSD)
TradingLounge Once Off SPECIAL DEAL: Here > 1 month Get 3 months.
Conclusion: In conclusion, Elliott Wave Analysis offers valuable insights into the current market dynamics of NEO/USD. With Wave (3) driving the uptrend, traders can capitalize on potential opportunities while staying vigilant for corrective phases. By aligning with the dominant trend and leveraging key technical indicators, traders can navigate the market with confidence and maximize profitability.
Stay tuned for further updates and analysis to optimize your trading strategy in the dynamic NEO/USD market.