Wheat Elliott Wave Technical Analysis
Wheat prices are experiencing a corrective bounce from the January 2025 low. However, it appears to be only a matter of time before the market resumes its long-term bearish trend, which began in March 2022.
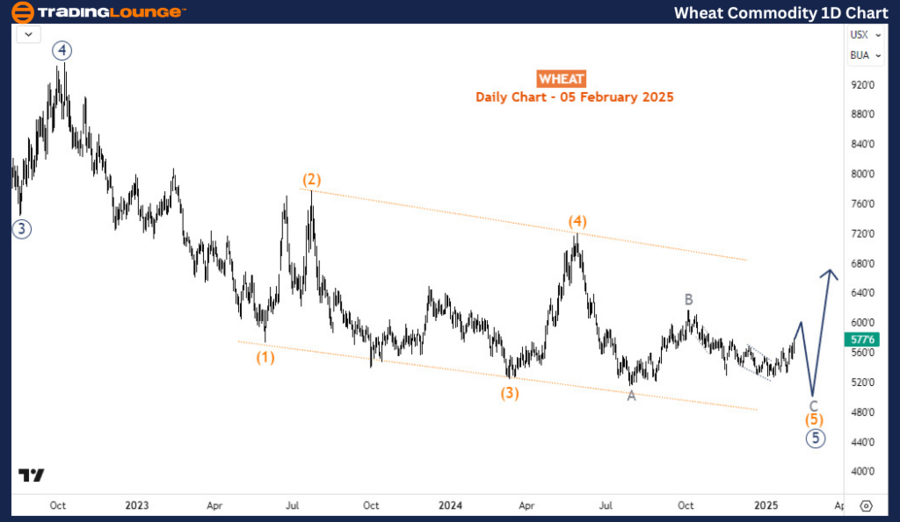
Wheat Commodity Daily Chart Analysis
Since March 2022, when wheat traded at $1364, prices have dropped by over 60%. This decline follows an impulse wave structure within the primary degree. The key wave levels are:
- Wave ((1)) – Completed in March 2022
- Wave ((2)) – Completed in May 2022
- Wave ((3)) – Completed in August 2022
- Wave ((4)) – Completed in October 2022
Wave ((5)) began after October 2022 and has extended for over two years. Structurally, wave ((5)) is developing as a diagonal structure.
The daily chart suggests that wheat is currently in wave C of (5) of ((5)). Once wave C of (5) is completed, wheat is expected to rebound, correcting the entire downtrend since March 2022. The key question remains: How much lower can wave C decline?
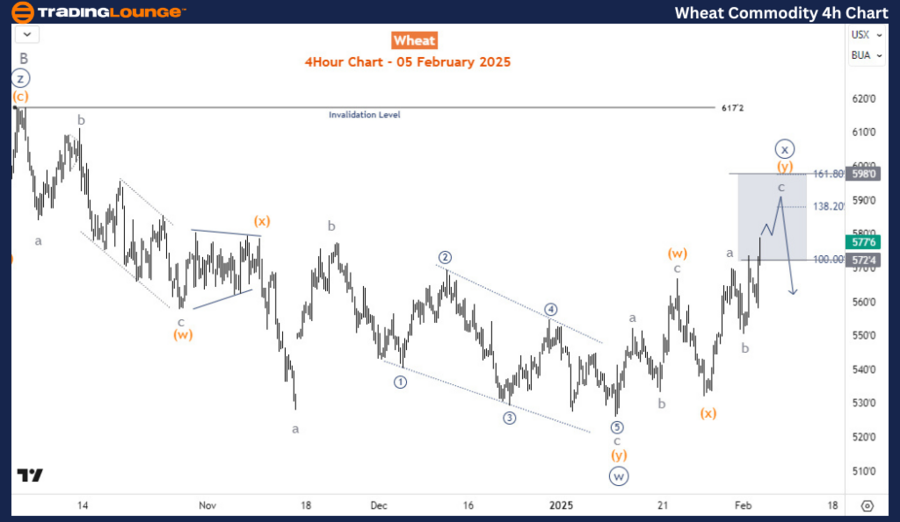
Wheat Commodity H4 Chart Analysis
On the H4 timeframe, the price action from the January 2025 low is taking shape as a double zigzag structure. This pattern has now reached the Fibonacci resistance zone between 572–597.
Key Elliott Wave Levels:
- If price finds resistance in this zone, it could trigger wave ((x)) of C, driving prices below 500.
- A breach of the 617 pivot would invalidate this wave count, suggesting a different corrective structure.
Wheat traders should monitor these key Fibonacci levels for potential reversal signals.
Technical Analyst: Sanmi Adeagbo
Source: visit Tradinglounge.com and learn From the Experts Join TradingLounge Here
See Previous: Silver (XAGUSD) Elliott Wave Technical Analysis
VALUE Offer - Buy 1 Month & Get 3 Months!Click here
Access 7 Analysts Over 200 Markets Covered. Chat Room With Support