23Jan

JSW STEEL Indian Stocks Elliott Wave Technical Analysis: Providing Insights into Stock Support and Resistance Levels, and Future Market Movements

JSW STEEL Stock Elliott Wave Analysis - TradingLounge Day Chart

JSW STEEL Indian Stock (1D Chart) Analysis

JSW STEEL – JSWSTEEL Elliott Wave Technical Analysis

Function: Counter Trend (Minor Degree Grey)

Mode: Corrective

Structure: Flat

Position: Minute Wave ((c)) Navy

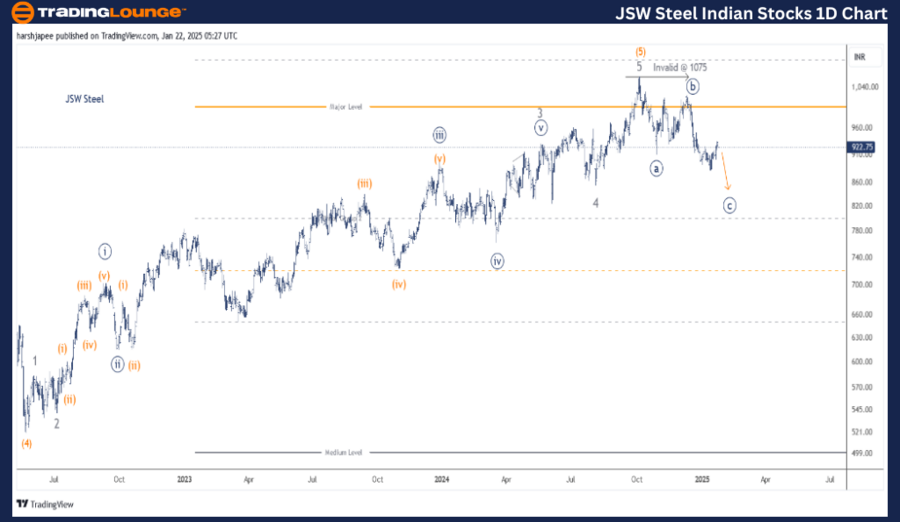
Details: Minute Wave ((c)) is currently moving lower, facing resistance at 1075, with potential termination around the 850-860 zone.

Invalidation point: 1075

JSW STEEL Daily Chart Technical Analysis and Elliott Wave Projection

The JSW STEEL daily chart signals a major top formation near 1075, identified as Minor Wave 5 within Intermediate Wave (5) Orange. Following this peak, a corrective drop at the Minuette degree is nearing completion or already concluded around the 840-850 zone.

In May 2022, JSW STEEL concluded Intermediate Wave (4) Orange around 520, leading to a five-wave rally at the Minor degree, labeled as 1 through 5, pushing the price to the 1075 high in October 2024. Observing the chart, a broader degree flat pattern could be evolving at the Minor degree level, with the 1075 mark acting as a critical resistance level.

JSW-STEEL-Indian-Sto...


JSW STEEL Stock Elliott Wave Analysis - TradingLounge 4h Chart

JSW STEEL – JSWSTEEL (4H Chart) Elliott Wave Technical Analysis

Function: Counter Trend (Minor Degree Grey)

Mode: Corrective

Structure: Flat

Position: Minute Wave ((c)) Navy

Details:

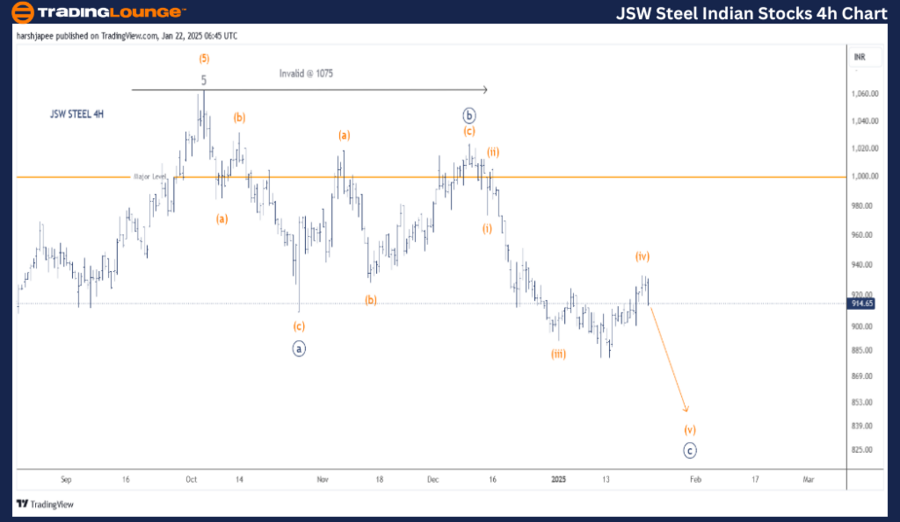
Minute Wave ((c)) is currently declining, holding resistance at 1075. The sub-waves indicate an impulsive movement and might have ended Minuette Wave (iv) Orange around 930, with a potential termination expected within the 850-860 range.

Invalidation point: 1075

JSW STEEL 4H Chart Technical Analysis and Elliott Wave Scenarios

The JSW STEEL 4-hour chart highlights sub-wave action following the 1075 high, marking the termination of Minor Wave 5 of (5). The sequence Minuette (a)-(b)-(c) concluded Wave ((a)) around 910, with Minute Wave ((b)) pushing back to 1020, subdividing into three distinct waves at the Minuette degree.

Currently, Minute Wave ((c)) continues to decline impulsively, with a possible target in the 850-860 zone, before bullish momentum might return. The 854 level, which marks the previous Wave 4 termination, could provide significant support.

Technical Analyst: Harsh Japee

Source: visit Tradinglounge.com and learn From the Experts Join TradingLounge Here 

Previous: ASIAN PAINTS Elliott Wave Technical Analysis

VALUE Offer - Buy 1 Month & Get 3 Months!Click here

Access 7 Analysts Over 200 Markets Covered. Chat Room With Support

JSW-STEEL-Indian-Sto...


Conclusion

JSW STEEL is in a downward phase within Minute Wave ((c)), targeting the 850-860 zone, with the 1075 mark serving as the key invalidation point.

Related

WTI Crudeoil Commodity Elliott Wave Technical analysis: Forecast future trends

WTI Crudeoil Commodity Elliott Wave Technical analysis: Forecast future trends

In this detailed analysis, we delve into the WTI Crude Oil market using Elliott Wave theory. We exam...

Read More >
TASI Index Elliott Wave Analysis: Bullish Trend Forecast and Key Invalidation Level Insights

TASI Index Elliott Wave Analysis: Bullish Trend Forecast and Key Invalidation Level Insights

The TASI Index is currently in a strong bullish phase, as identified by Elliott Wave analysis. With ...

Read More >
Elliott Wave Analysis and Trading Strategies for NASDAQ and Major Tech Stocks

Elliott Wave Analysis and Trading Strategies for NASDAQ and Major Tech Stocks

This week, our Elliott Wave analysis tracks two bullish counts for the NASDAQ 100 (NDX) and key tech...

Read More >
Providing Traders with Australian Dollar / Japanese Yen (AUDJPY) Forex Elliott Wave Technical Analysis and Insights

Providing Traders with Australian Dollar / Japanese Yen (AUDJPY) Forex Elliott Wave Technical Analysis and Insights

Explore detailed AUDJPY Elliott Wave Analysis focusing on daily chart trends, wave structures, and m...

Read More >
Cocoa Commodity Elliott Wave Technical Analysis: Navigating Current Trends and Future Possibilities

Cocoa Commodity Elliott Wave Technical Analysis: Navigating Current Trends and Future Possibilities

Discover the latest insights into the cocoa market with our in-depth Elliott Wave analysis. Learn ab...

Read More >
U.S.Dollar/Japanese Yen (USDJPY) Elliott Wave Technical Analysis 18 January 24

U.S.Dollar/Japanese Yen (USDJPY) Elliott Wave Technical Analysis 18 January 24

In conclusion, the USDJPY Elliott Wave Analysis for the daily chart on 18 January 24, suggests a cou...

Read More >

$1 for 2 Weeks

then $29 a month!

What a Special Offer!

Trade Recommendations

Unleash the power of deversified trading with our comprehensive portfolio, covering 250+ markets:

  • Stock Trades
  • Crypto Trades
  • Forex Trades
  • Commodity Trades
Elliott Wave Analysis

Gain a competitive edge with expert insights and AI-powered Elliott Wave charting into:

  • Global Indices
  • US Stocks & ASX Stocks
  • Forex & Crypto
  • Commodities
Top-Notch Trading Tools

Equip yourself with the tools of success:

  • Real-time Chat rooms
  • Elliott Wave Algorithm
  • Portfolio tools
  • TradingLevels
  • Screener
  • Trading Game
7 Elliott Wave Analysts

Stay ahead of the market with daily charts and insightful videos
Your secret to strategic trading!

JOIN HERE


Welcome to TradingLounge (ASIC A.R.No. 321187), specialists in trades, trading education and technical analysis, covering stocks, indices, commodities, forex and cryptocurrencies.

When you join TradingLounge you have access to everything we offer, including trade tools, educational content and a social platform to chat with like-minded investors.

Read more

@Copyright 2024 by tradinglounge.com

Contact Us

Australian no: 02 4787 6020

International no: +61 (2) 47876020

Pay with:

Find us on