03Apr

ASX NEM Stock Forecast: Newmont Corporation Elliott Wave Analysis, Bullish Trend Outlook, Trading Strategy, and Technical Insights

ASX: NEWMONT CORPORATION – NEM Elliott Wave Technical Analysis – TradingLounge

Greetings,
This Elliott Wave technical update centers on Newmont Corporation (ASX: NEM), listed on the Australian Stock Exchange.

Our wave analysis indicates strong long-term bullish potential for ASX:NEM shares.


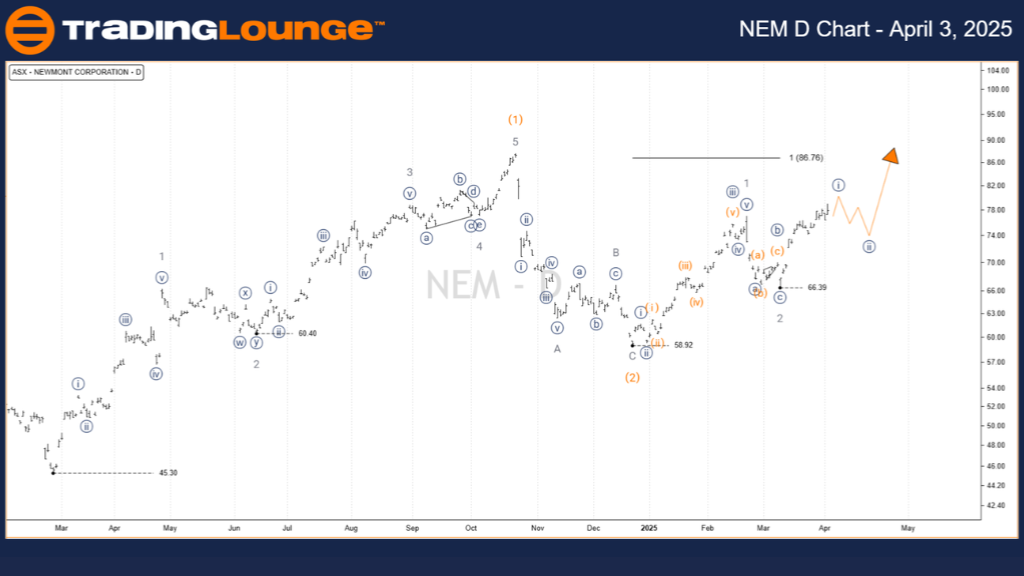
ASX: NEWMONT CORPORATION – NEM 1D Chart (Semilog Scale) Analysis

Function: Major Trend (Intermediate degree, orange)

Mode: Motive

Structure: Impulse

Position: Wave 3-grey of Wave (3)-orange

Analysis Summary:
Wave (2)-orange concluded near the support level of 58.92. The market is now advancing into wave (3)-orange, suggesting higher price momentum. Within this structure, wave 1-grey has finalized, and wave 2-grey appears to have ended as well. The focus now shifts to wave 3-grey, which is targeting a potential move towards the $100.00 resistance zone.

Invalidation Point: 66.39

NEWMONT-CORPORATION-...


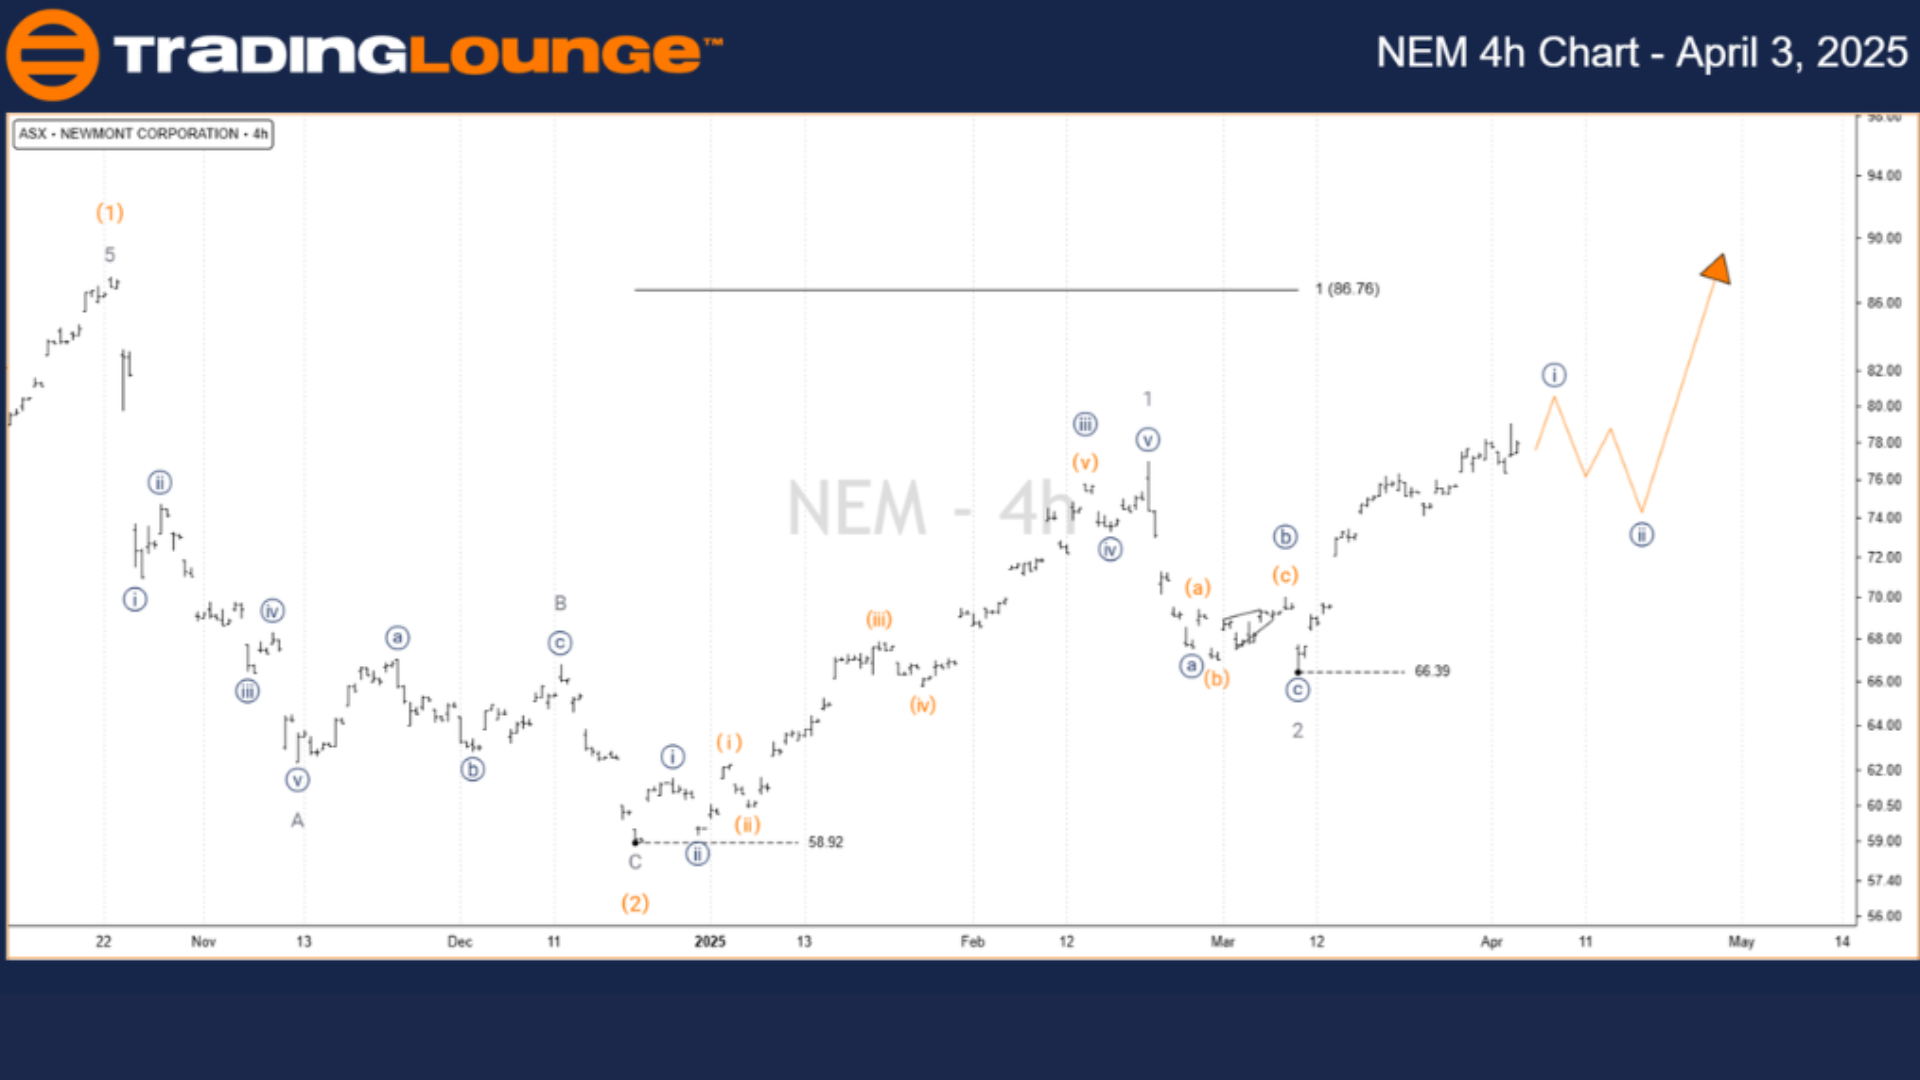
ASX: NEWMONT CORPORATION – NEM Elliott Wave Technical Analysis – TradingLounge (4-Hour Chart)

Function: Major Trend (Minor degree, grey)

Mode: Motive

Structure: Impulse

Position: Wave ((i))-navy of Wave 3-grey

Detailed View:
Starting from 66.39, wave ((i))-navy is nearly complete. The next expectation is a corrective wave ((ii))-navy, likely unfolding in an ABC pattern. Afterward, wave ((iii))-navy is forecast to continue the upward movement in alignment with the larger trend.

Invalidation Point: 66.39

Technical Analyst: Hua (Shane) Cuong, CEWA-M (Master’s Designation).

Source: Visit Tradinglounge.com and learn from the Experts. Join TradingLounge Here 

See Previous: NAB Elliott Wave Technical Analysis

VALUE Offer - Buy 1 Month & Get 3 Months!Click here

Access 7 Analysts Over 200 Markets Covered. Chat Room With Support

NEWMONT-CORPORATION-...


Conclusion:
This Elliott Wave technical forecast outlines a structured and data-driven approach to analyzing Newmont Corporation (ASX: NEM). By defining key price levels for validation or invalidation, the analysis supports informed trading strategies. The current wave count points to an evolving bullish phase, helping traders recognize potential opportunities in the ongoing trend.

Related

XRP/ U.S. dollar(XRPUSD) Elliott Wave Analysis: Predicting Price Trends, Triangle Pattern Signals

XRP/ U.S. dollar(XRPUSD) Elliott Wave Analysis: Predicting Price Trends, Triangle Pattern Signals

XRP technical analysis covers the current price movement, Elliott Wave patterns, and trading strateg...

Read More >
Netflix Inc. (NFLX) Elliott Wave Technical Analysis: Investment Insights, Financial Performance, and Growth Potential for 2025

Netflix Inc. (NFLX) Elliott Wave Technical Analysis: Investment Insights, Financial Performance, and Growth Potential for 2025

Netflix Inc. (NFLX) with our comprehensive stock analysis. This report covers key financial performa...

Read More >
U.S.Dollar/Swiss Franc (USD/CHF) Elliott Wave Technical Analysis Trading Lounge: In-Depth Technical Insights

U.S.Dollar/Swiss Franc (USD/CHF) Elliott Wave Technical Analysis Trading Lounge: In-Depth Technical Insights

Our USD/CHF Elliott Wave Analysis provides traders with valuable insights into the current market dy...

Read More >
Key Levels and Patterns that Could Impact Visa's Stock Price: Visa Inc. (V) Stocks Elliott Wave Technical Analysis

Key Levels and Patterns that Could Impact Visa's Stock Price: Visa Inc. (V) Stocks Elliott Wave Technical Analysis

Our detailed Elliott Wave analysis for Visa Inc. (V) explores both daily and 1-hour charts to provid...

Read More >
Elliott Wave Technical Analysis for AAVE/ U.S. dollar(AAVEUSD) - Bullish Signals and Strategies | February 14, 2024

Elliott Wave Technical Analysis for AAVE/ U.S. dollar(AAVEUSD) - Bullish Signals and Strategies | February 14, 2024

The summary provides an overview of the latest Elliott Wave Analysis conducted on February 14, 2024,...

Read More >
ASX FPH Stock Analysis: Fisher & Paykel Healthcare Elliott Wave Forecast, Wave 4 Triangle Pattern, and Price Prediction Insights

ASX FPH Stock Analysis: Fisher & Paykel Healthcare Elliott Wave Forecast, Wave 4 Triangle Pattern, and Price Prediction Insights

Elliott Wave analysis for ASX: FPH (Fisher & Paykel Healthcare Corporation Limited). Our technical a...

Read More >

Buy 1 Month

Get 3 Months!

Special Offer:

Trade Recommendations

Unleash the power of deversified trading with our comprehensive portfolio, covering:

  • Stock Trades
  • Crypto Trades
  • Forex Trades
  • Commodity Trades
Elliott Wave Analysis

Gain a competive edge with expert insights in to:

  • Global Indices
  • US Stocks & ASX Stocks
  • Forex & Crypto
  • Commodities
Top-Notch Trading Tools

Equip yourself with the tools of success:

  • Social Chat
  • Elliott Wave Algorithm
  • Screener
  • TradingLevels
  • Trading Game
7 Elliott Wave Analysts

Stay ahead of the market with daily charts and insightful videos
-Your secret to strategic trading!

JOIN HERE


Welcome to TradingLounge (ASIC A.R.No. 321187), specialists in trades, trading education and technical analysis, covering stocks, indices, commodities, forex and cryptocurrencies.

When you join TradingLounge you have access to everything we offer, including trade tools, educational content and a social platform to chat with like-minded investors.

Read more

@Copyright 2024 by tradinglounge.com

Contact Us

Australian no: 02 4787 6020

International no: +61 (2) 47876020

Pay with:

Find us on