Welcome to our latest Elliott Wave analysis for Apple Inc. (AAPL). This analysis provides an in-depth look at AAPL's price movements using the Elliott Wave Theory, helping traders identify potential opportunities based on current trends and market structure. We will cover insights from both the daily and 4-hour charts to offer a comprehensive perspective on AAPL's market behavior.

AAPL Elliott Wave Analysis Trading Lounge Daily Chart

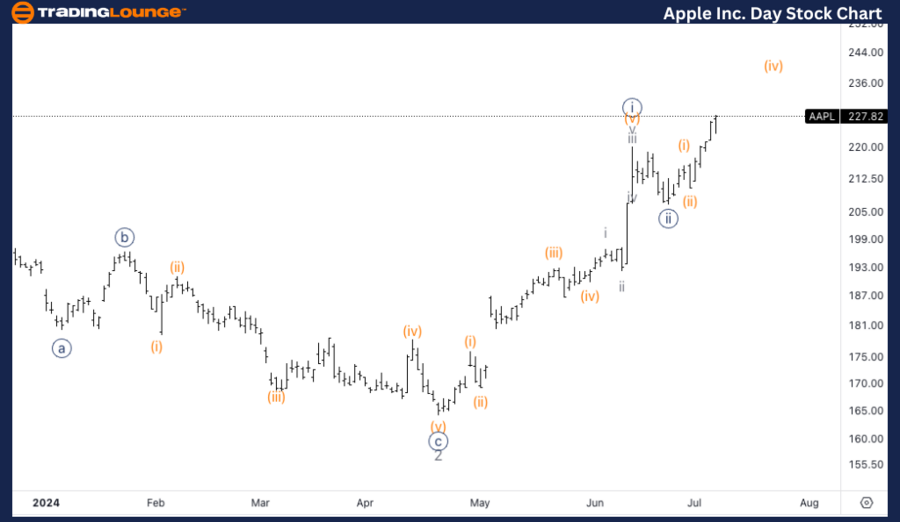
Apple Inc. (AAPL) Daily Chart Analysis

AAPL Stock Technical Analysis

Function: Trend

Mode: Impulsive

Structure: Motive

Position: Wave 3

Direction: Upside in wave 3

Details: Looking for wave 3 to unfold as we seem to be in a third of a third. Equality of 3 vs. 1 stands at $254, while 1.618 3 vs. 1 stands at $350.

AAPL Elliott Wave Technical Analysis– Daily Chart

The daily chart indicates that AAPL is in the midst of wave 3, specifically in the third of a third wave, which is often the most powerful phase in the Elliott Wave sequence. The equality of wave 3 vs. wave 1 stands at $254, while the 1.618 extension of wave 3 vs. wave 1 targets $350. This suggests substantial upside potential if the wave structure unfolds as expected. Traders should monitor for strong upward movements and prepare for potential resistance at these key levels.
Apple-Inc-Day-Stock-...


AAPL Elliott Wave Analysis Trading Lounge 4Hr Chart

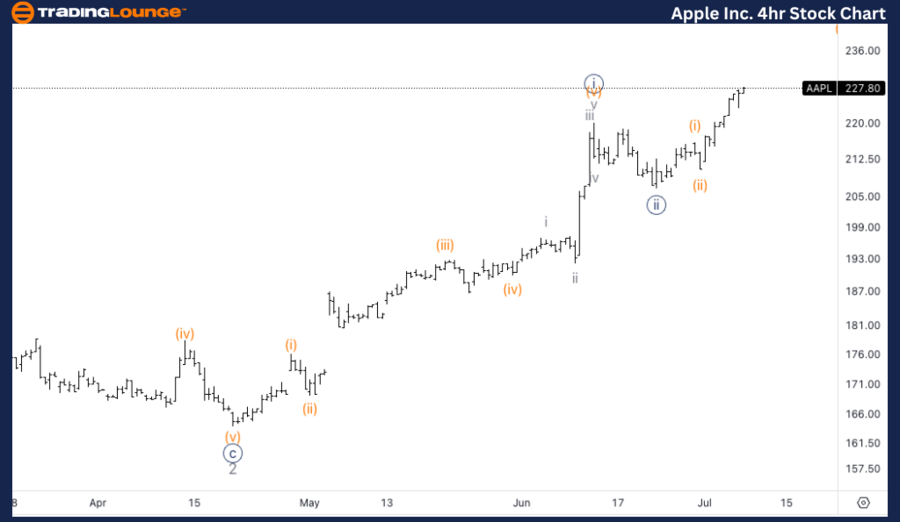
Apple Inc. (AAPL) 4Hr Chart Analysis

AAPL Technical Analysis

Function: Trend

Mode: Impulsive

Structure: Motive

Position: Wave {iii}

Direction: Upside in (iii) of {iii}

Details: Looking for upside into wave (iii). We could expect some “turbulence” around $230 at the end of MG1, to then move towards Medium Level at $250.

AAPL Elliott Wave Technical Analysis – 4Hr Chart

The 4-hour chart shows that AAPL is advancing into wave (iii) of {iii}. As wave (iii) progresses, we can expect some “turbulence” around the $230 level, which corresponds to the end of MinorGroup1 (MG1). After overcoming this level, the next target is the Medium Level at $250. This aligns with the daily chart's projection and reinforces the bullish scenario.

Technical Analyst: Alessio Barretta

Source: visit Tradinglounge.com and learn From the Experts Join TradingLounge Here 

See Previous: Alphabet Inc., (GOOGL) Elliott Wave Technical Analysis

Special Trial Offer - 0.76 Cents a Day for 3 Months! Click here

Access 7 Analysts Over 170 Markets Covered. Chat Room With Support
Apple-Inc-4hr-Stock-...

Related

HCL Technologies Stock Analysis: HCLTECH Elliott Wave Technical Analysis Covers Chart Insights and a Detailed Forecast

HCL Technologies Stock Analysis: HCLTECH Elliott Wave Technical Analysis Covers Chart Insights and a Detailed Forecast

This article provides a comprehensive Elliott Wave analysis of HCL Technologies (HCLTECH) stock. It ...

Read More >
Newmont Corporation ASX: NEM Elliott Wave Analysis Reveals Bullish Price Targets and Trading Signals for Gold Stock Investors

Newmont Corporation ASX: NEM Elliott Wave Analysis Reveals Bullish Price Targets and Trading Signals for Gold Stock Investors

Elliott Wave analysis for Newmont Corporation (ASX: NEM), highlighting key price targets, bullish st...

Read More >
WISETECH GLOBAL (ASX: WTC) Stock Set for Major Move: Elliott Wave Forecast Reveals Key Price Targets!

WISETECH GLOBAL (ASX: WTC) Stock Set for Major Move: Elliott Wave Forecast Reveals Key Price Targets!

This analysis provides an in-depth Elliott Wave forecast for WISETECH GLOBAL LIMITED (WTC) on the Au...

Read More >
Riding the Uptrend: ChainLink/U.S. Dollar (LINKUSD) Elliott Waves Technical Analysis by Expert

Riding the Uptrend: ChainLink/U.S. Dollar (LINKUSD) Elliott Waves Technical Analysis by Expert

Discover the keys to unlocking profitable trades in the ChainLink/USD (LINKUSD) market with expert i...

Read More >
Commodity Markets: BITCOIN, BONDS, YIELDS, DOLLAR, GOLD, SILVER, ORE, OIL, COPPER, GAS, Elliott Wave

Commodity Markets: BITCOIN, BONDS, YIELDS, DOLLAR, GOLD, SILVER, ORE, OIL, COPPER, GAS, Elliott Wave

The latest Elliott Wave Analysis for the commodity market suggests a positive trajectory for cryptoc...

Read More >
New Zealand Dollar/U.S.Dollar (NZDUSD) Elliott Wave Technical Analysis 12 January 24

New Zealand Dollar/U.S.Dollar (NZDUSD) Elliott Wave Technical Analysis 12 January 24

NZDUSD Elliott Wave Analysis for the daily chart on 12 January 24, suggests that the market is curre...

Read More >

$1 for 2 Weeks

then $29 a month!

What a Special Offer!

Trade Recommendations

Unleash the power of deversified trading with our comprehensive portfolio, covering 250+ markets:

  • Stock Trades
  • Crypto Trades
  • Forex Trades
  • Commodity Trades
Elliott Wave Analysis

Gain a competitive edge with expert insights and AI-powered Elliott Wave charting into:

  • Global Indices
  • US Stocks & ASX Stocks
  • Forex & Crypto
  • Commodities
Top-Notch Trading Tools

Equip yourself with the tools of success:

  • Real-time Chat rooms
  • Elliott Wave Algorithm
  • Portfolio tools
  • TradingLevels
  • Screener
  • Trading Game
7 Elliott Wave Analysts

Stay ahead of the market with daily charts and insightful videos
Your secret to strategic trading!

JOIN HERE


Welcome to TradingLounge (ASIC A.R.No. 321187), specialists in trades, trading education and technical analysis, covering stocks, indices, commodities, forex and cryptocurrencies.

When you join TradingLounge you have access to everything we offer, including trade tools, educational content and a social platform to chat with like-minded investors.

Read more

@Copyright 2024 by tradinglounge.com

Contact Us

Australian no: 02 4787 6020

International no: +61 (2) 47876020

Pay with:

Find us on