EICHER MOTORS Elliott Wave Analysis | Trading Lounge Day Chart
EICHER MOTORS Stock Day Chart Analysis
EICHER MOTORS Elliott Wave Technical Analysis
FUNCTION: Bullish Trend
MODE: Impulsive
STRUCTURE: Orange Wave 3
POSITION: Navy Blue Wave 5
DIRECTION NEXT LOWER DEGREES: Orange Wave 4
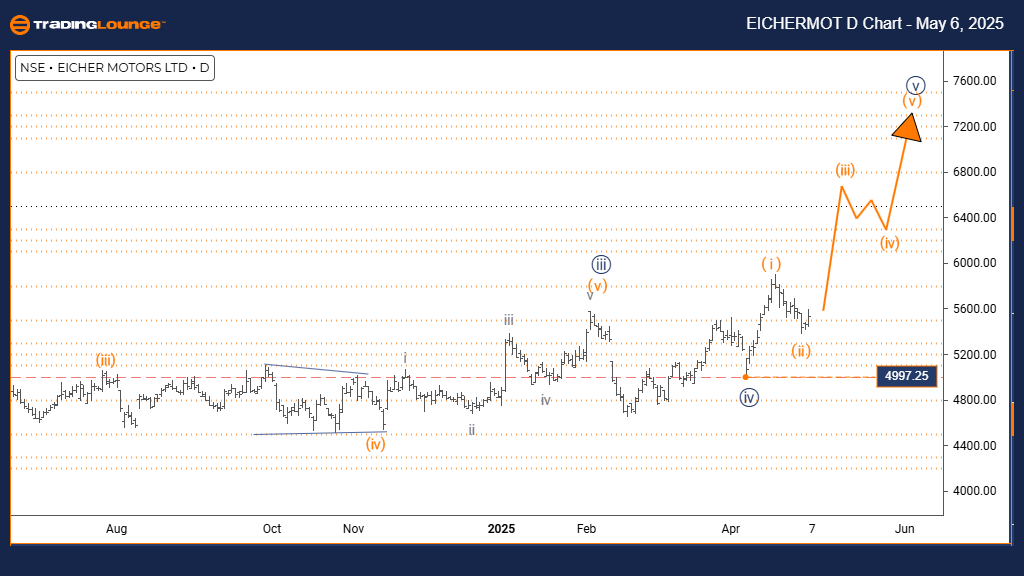
DETAILS: Orange wave 2 looks complete, and orange wave 3 has started.
Wave Cancel/Invalid Level: 4997.25
The EICHER MOTORS daily chart underlines a bullish trend developing through a clean, impulsive Elliott Wave structure. After completing the orange wave 2 correction, the stock has entered orange wave 3, progressing within the broader navy blue wave 5 formation. This phase typically marks the strongest segment of the market’s bullish momentum.
Orange wave 3 usually drives the most powerful gains in Elliott Wave trading, characterized by rapid and decisive price action. Ending wave 2’s correction confirms a clear path for a robust wave 3 rally, often outpacing wave 1. Current wave patterns suggest the uptrend will continue until another correction phase occurs.
It is essential to monitor the key invalidation level at 4997.25. Should prices drop below this level, the existing bullish outlook would become invalid, demanding a wave structure reevaluation.
The daily timeframe provides a detailed view of the ongoing impulsive wave structure, supporting the expectation of further price increases. Traders should anticipate typical wave 3 dynamics — strong, aggressive movement — while keeping an eye on the critical invalidation mark. Current analysis supports a bullish perspective until wave 3 reaches maturity.
Technical indicators like volume and momentum will be crucial for verifying wave progression. As the stock moves through navy blue wave 5 of a higher degree, the underlying bullish strength remains intact.
Upon completion of orange wave 3, the next stage will be orange wave 4, introducing a corrective period before potential bullish continuation. Right now, wave 3 presents an attractive opportunity for trend-following strategies.
EICHER MOTORS Elliott Wave Analysis | Trading Lounge Weekly Chart
EICHER MOTORS Elliott Wave Technical Analysis
FUNCTION: Bullish Trend
MODE: Impulsive
STRUCTURE: Navy Blue Wave 5
POSITION: Gray Wave 3
DIRECTION NEXT LOWER DEGREES: Gray Wave 4
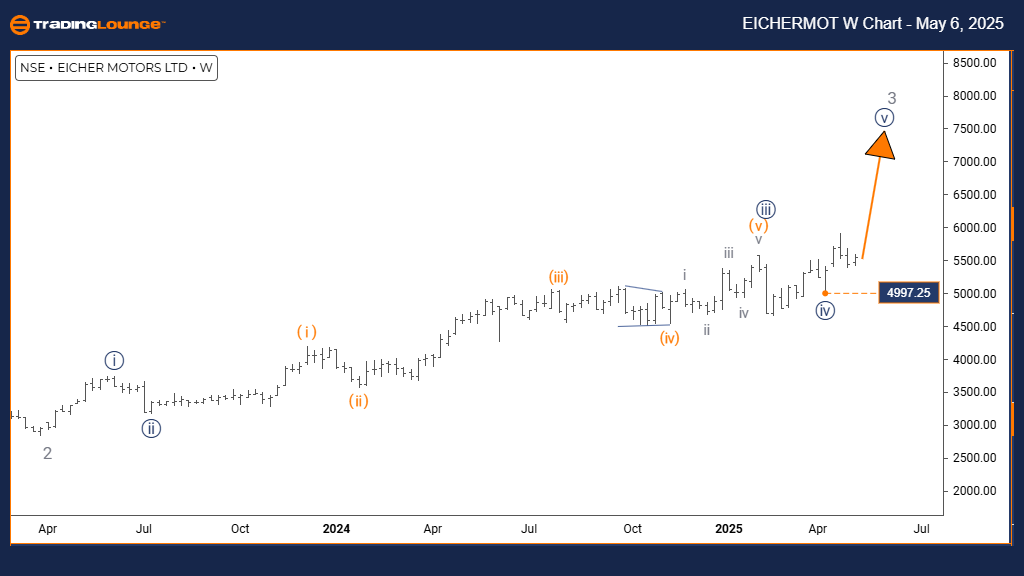
DETAILS: Navy blue wave 4 looks finalized, and navy blue wave 5 is developing.
Wave Cancel/Invalid Level: 4997.25
The EICHER MOTORS weekly chart continues to reflect a bullish trend moving towards its later stages within an impulsive Elliott Wave structure. Completing navy blue wave 4, the stock has transitioned into navy blue wave 5, nested inside the larger gray wave 3 formation. This structure suggests a major bullish move nearing completion.
Navy blue wave 5 usually marks the final surge in a bullish Elliott Wave sequence. While it can maintain strong momentum, signs of trend weakening often appear as the sequence matures. Following wave 4’s correction, wave 5 often challenges or surpasses previous highs, but traders should remain alert for signs of exhaustion.
The weekly timeframe delivers critical confirmation of this bullish sequence. Progression into gray wave 3 hints that although the trend nears maturity, a broader bullish cycle still supports the price action.
It remains crucial to track the 4997.25 invalidation level. A breakdown beneath this price would undermine the current bullish interpretation and call for a structural reassessment.
Traders should closely monitor navy blue wave 5 for any signs of weakening momentum, such as bearish divergence on indicators or reversal candlestick formations. The analysis suggests being cautious as the wave matures, even though occasional extensions can prolong the rally.
Validating momentum loss and reversal patterns with technical tools will be key in identifying the likely conclusion of navy blue wave 5. When this wave ends, a significant market correction is expected. Careful observation of price trends will help optimize exit strategies as the bullish sequence comes to an end.
Technical Analyst: Malik Awais
Source: Visit Tradinglounge.com and learn from the Experts. Join TradingLounge Here
Previous: ASIAN PAINT Elliott Wave Technical Analysis
VALUE Offer - Buy 1 Month & Get 3 Months!Click here
Access 7 Analysts Over 200 Markets Covered. Chat Room With Support
Key Takeaways for Traders:
- Watch 4997.25 as the critical invalidation level.
- Expect strong momentum during orange wave 3 and navy blue wave 5.
- Monitor momentum indicators and price action closely for wave maturity signs.
- Prepare for a corrective phase once current impulsive waves conclude.