16Feb

Unlocking Potential Gains: META Platforms Inc. (META) Elliott Wave Technical Analysis offering actionable insights

META Elliott Wave Analysis Trading Lounge Daily Chart, 16 February 24

Welcome to our META Elliott Wave Analysis Trading Lounge, your ultimate source for comprehensive insights into Meta Platforms Inc. (META) using Elliott Wave Technical Analysis. As of the Daily Chart on 16th February 2024, we explore significant trends guiding the market.

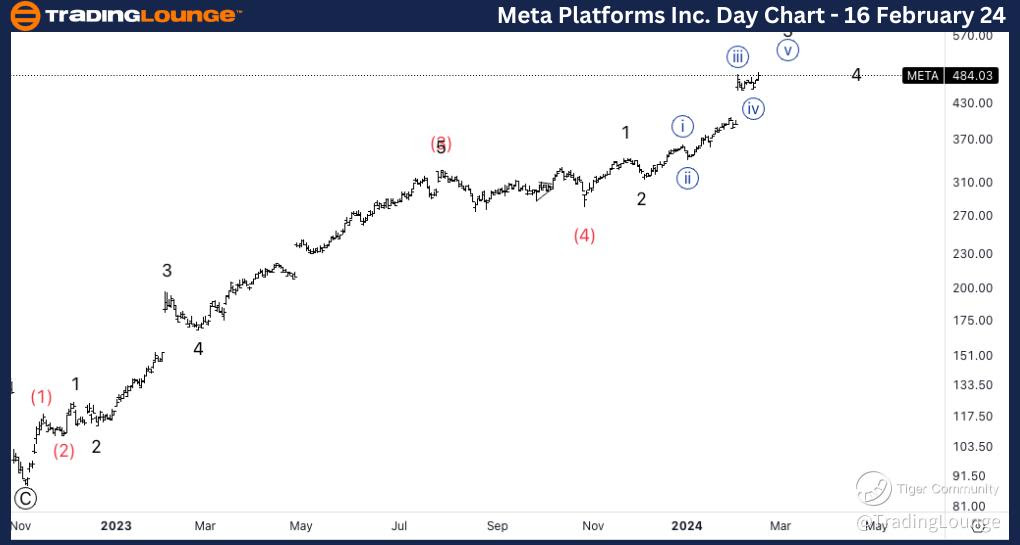
Meta Platforms Inc., (META) Daily Chart

META Elliott Wave Technical Analysis

In terms of wave dynamics, we identify a dominant impulse function with a motive structure. The current position is in Minute wave {v} of 3, indicating a potential topping in wave {v} of 3. We observe a robust upward movement from the $80 lows. Our analysis considers the possibility of wave (5) being in place, or alternatively, wave (3) and (4) could signify higher degree wave 1 and 2, suggesting the onset of higher degree wave 3.

FUNCTION: Trend

MODE: Impulse

STRUCTURE: Motive

POSITION: Minute wave {v} of 3.  

DIRECTION: Topping in wave {v} of 3.  

Examining the price action, there's a notable uptrend from the $80 lows, indicating significant bullish momentum. However, it's crucial to note that wave (5) might already be in place, or what's labeled as wave (3) and (4) could represent higher degree waves 1 and 2, suggesting the onset of a higher degree wave 3.

Meta-Platforms-Day-C...


META Elliott Wave Analysis Trading Lounge 4Hr Chart, 16 February 24

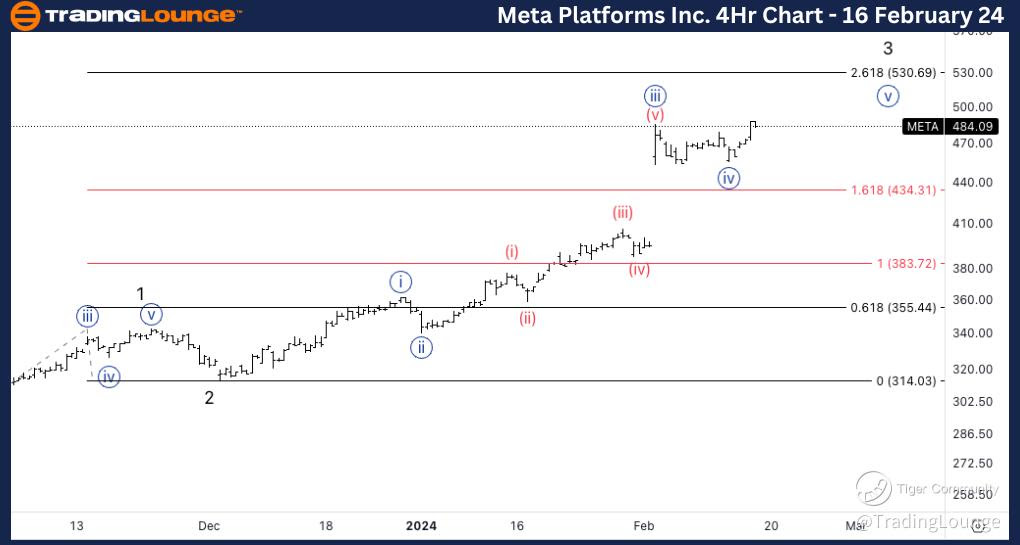
Meta Platforms Inc.,  (META) 4Hr Chart

META Elliott Wave Technical Analysis – 4Hr Chart

Here, the wave function remains impulsive with a motive structure. The present position is in Wave (i) of {v}, signaling a continuation higher towards the wave 3 target. The wave 3 target is anticipated to be at least $500, intersecting with TL5. Additionally, there's a Fib relationship of 2.618 between wave 3 and wave 1 at $530. Overall, we expect the $500 target to be reached before witnessing significant downside pressure in the market.

FUNCTION: Trend

MODE: Impulsive

STRUCTURE: Motive

POSITION: Wave (i) of {v}.

DIRECTION: Continuation higher towards wave 3 target.  

Analyzing the details, the wave 3 target is projected to reach at least $500, intersecting a significant TL5. Furthermore, a Fibonacci relationship of 2.618 between waves 3 and 1 points to a potential target of $530. Overall, there's an expectation for the $500 target to be attained before witnessing significant downside pressure in the market.

Technical Analyst: Alessio Barretta

Source: visit Tradinglounge.com and learn From the Experts Join TradingLounge Here 

See Previous: The Walt Disney Company (DIS)

Meta-Platforms-4hr-C...

In conclusion, Meta Platforms Inc. (META) presents intriguing opportunities for traders, as evidenced by its compelling Elliott Wave patterns. With a thorough understanding of the current wave structures and price dynamics, traders can make informed decisions to capitalize on potential price movements.

Related

Discover the in-depth Deere & Co.(DE) Stocks Elliott Wave Technical Analysis

Discover the in-depth Deere & Co.(DE) Stocks Elliott Wave Technical Analysis

Discover the in-depth Elliott Wave Analysis for Deere & Co. (DE), focusing on daily and 4-hour chart...

Read More >
New Zealand Dollar/U.S.DollarCurrency Pair: NZDUSD Forex Elliott Wave Technical Analysis

New Zealand Dollar/U.S.DollarCurrency Pair: NZDUSD Forex Elliott Wave Technical Analysis

Explore our comprehensive NZDUSD Elliott Wave analysis, including detailed day and 4-hour chart revi...

Read More >
Corn Commodity Elliott Wave Technical Analysis: Stay Informed and Make Strategic Decisions in the Commodity Trading Landscape

Corn Commodity Elliott Wave Technical Analysis: Stay Informed and Make Strategic Decisions in the Commodity Trading Landscape

Explore the latest Elliott Wave Analysis for Corn, highlighting bearish trends and potential market ...

Read More >
U.S.Dollar/Swiss Franc(USDCHF) Elliott Wave Analysis: Daily Chart Review - February 2, 2024

U.S.Dollar/Swiss Franc(USDCHF) Elliott Wave Analysis: Daily Chart Review - February 2, 2024

Unlock profitable trading opportunities with expert insights from the latest USDCHF Elliott Wave Ana...

Read More >
Cryptocurrency Pair Profit Potential: Elliott Wave Technical Analysis of Uniswap/USD (UNIUSD)

Cryptocurrency Pair Profit Potential: Elliott Wave Technical Analysis of Uniswap/USD (UNIUSD)

Explore the potential for profitable trading in the UNIUSD (Uniswap/U.S. dollar) cryptocurrency pair...

Read More >
Explore the latest Elliott Wave analysis for ASX LNW: LIGHT & WONDER INC ASX Trading Success

Explore the latest Elliott Wave analysis for ASX LNW: LIGHT & WONDER INC ASX Trading Success

Explore the latest Elliott Wave analysis for ASX LNW (LIGHT & WONDER INC.). Our expert insights offe...

Read More >

Buy 1 Month

Get 3 Months!

Special Offer:

Trade Recommendations

Unleash the power of deversified trading with our comprehensive portfolio, covering:

  • Stock Trades
  • Crypto Trades
  • Forex Trades
  • Commodity Trades
Elliott Wave Analysis

Gain a competive edge with expert insights in to:

  • Global Indices
  • US Stocks & ASX Stocks
  • Forex & Crypto
  • Commodities
Top-Notch Trading Tools

Equip yourself with the tools of success:

  • Social Chat
  • Elliott Wave Algorithm
  • Screener
  • TradingLevels
  • Trading Game
7 Elliott Wave Analysts

Stay ahead of the market with daily charts and insightful videos
-Your secret to strategic trading!

JOIN HERE


Welcome to TradingLounge (ASIC A.R.No. 321187), specialists in trades, trading education and technical analysis, covering stocks, indices, commodities, forex and cryptocurrencies.

When you join TradingLounge you have access to everything we offer, including trade tools, educational content and a social platform to chat with like-minded investors.

Read more

@Copyright 2024 by tradinglounge.com

Contact Us

Australian no: 02 4787 6020

International no: +61 (2) 47876020

Pay with:

Find us on