18Jul

Advanced Micro Devices Inc. (AMD) Elliott Wave Technical Analysis Provides Traders with Valuable insights into AMD's price movements

Welcome to Our Latest Elliott Wave Analysis for Advanced Micro Devices Inc. (AMD)

This analysis delves into AMD's price movements using Elliott Wave Theory, aiding traders in spotting potential opportunities based on current trends and market structure. Insights from both the daily and 4-hour charts provide a comprehensive perspective on AMD's market behavior.

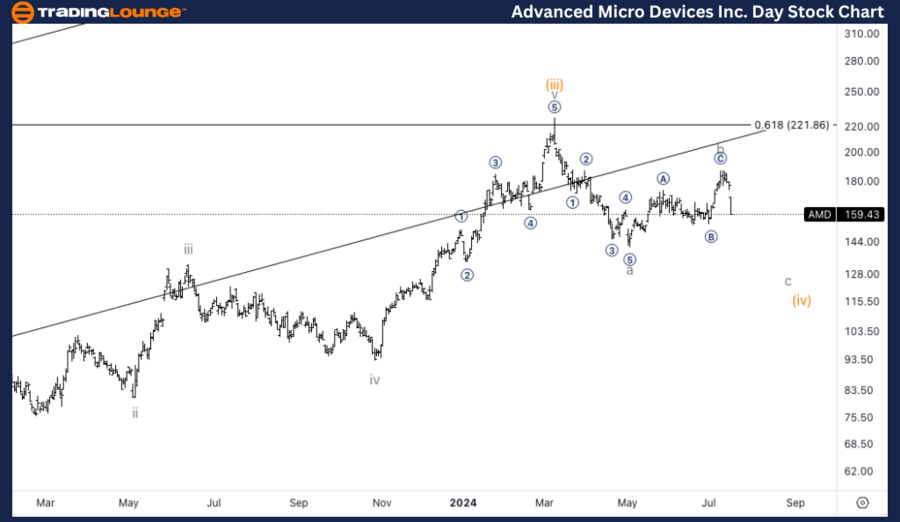
AMD Elliott Wave Analysis Trading Lounge Daily Chart

Advanced Micro Devices Inc. (AMD) Daily Chart Analysis

AMD Elliott Wave Technical Analysis

Function: Counter Trend

Mode: Corrective

Structure: Zigzag

Position: Minuette wave (iv)

Direction: Downside into wave c of (iv)

Details: We anticipate a downside move into wave c to complete the overall correction in wave (iv).

AMD Elliott Wave Technical Analysis – Daily Chart

The daily chart suggests further downside movement into wave c of (iv) to complete the overall correction. The anticipated completion of wave c will signify the end of the corrective phase in wave (iv). Traders should watch for signs of this downside move to identify potential buying opportunities as the correction concludes.

Advanced-Micro-Devic...


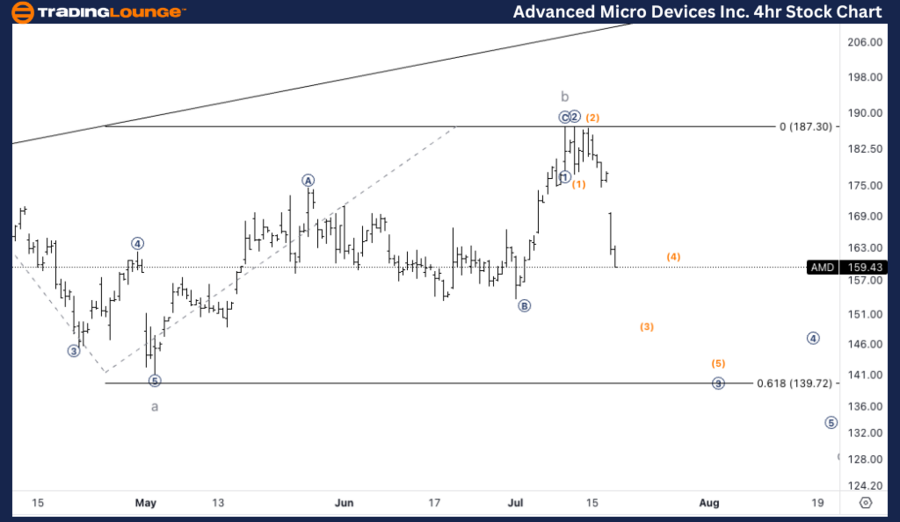
AMD Elliott Wave Analysis Trading Lounge 4Hr Chart

Advanced Micro Devices Inc. (AMD) 4Hr Chart Analysis

AMD Elliott Wave Technical Analysis

Function: Counter Trend

Mode: Corrective

Structure: Zigzag

Position: Subminuette Wave c

Direction: Downside into micro wave 3

Details: We are closely observing subminuette wave c, looking for a series of threes and fours as indicated in the chart.

AMD Elliott Wave Technical Analysis – 4Hr Chart

The 4-hour chart shows subminuette wave c unfolding. We expect a series of smaller degree waves (threes and fours) to develop, indicating further downside movement into micro wave 3. Traders should monitor these wave formations to confirm the ongoing corrective phase and prepare for potential short-term trading opportunities.

Technical Analyst: Alessio Barretta

Source: visit Tradinglounge.com and learn From the Experts Join TradingLounge Here 

See Previous: Palo Alto Networks Inc. (PANW) Ellott Wave Technical Analysis

Special Trial Offer - 0.76 Cents a Day for 3 Months! Click here

Access 7 Analysts Over 170 Markets Covered. Chat Room With Support

Advanced-Micro-Devic...

Related

Australian Dollar/U.S. Dollar Elliott Wave Analysis Showing Bullish Trend as Orange Wave 3 Develops on Day and 4-Hour Charts

Australian Dollar/U.S. Dollar Elliott Wave Analysis Showing Bullish Trend as Orange Wave 3 Develops on Day and 4-Hour Charts

AUDUSD shows a confirmed bullish Elliott Wave pattern with Orange Wave 3 in progress. Day and 4-hour...

Read More >
Forex Market Movement and Trading Decisions With Our in-depth U.S. Dollar /Swiss Franc (USDCHF) Elliott Wave Technical Analysis

Forex Market Movement and Trading Decisions With Our in-depth U.S. Dollar /Swiss Franc (USDCHF) Elliott Wave Technical Analysis

Our in-depth USDCHF Elliott Wave Analysis covers daily and 4-hour charts, highlighting key trends, i...

Read More >
U.S. Dollar / Japanese Yen (USDJPY) Elliott Wave Analysis: Daily and 4-Hour Chart Forecasts, Bullish Trends and Forex Trading

U.S. Dollar / Japanese Yen (USDJPY) Elliott Wave Analysis: Daily and 4-Hour Chart Forecasts, Bullish Trends and Forex Trading

USDJPY Elliott Wave analysis, covering both daily and 4-hour charts. Learn about the current bullish...

Read More >
EUR/USD Elliott Wave Analysis Reveals Bullish Impulse Pattern Suggesting Continued Uptrend in Forex Market

EUR/USD Elliott Wave Analysis Reveals Bullish Impulse Pattern Suggesting Continued Uptrend in Forex Market

The EUR/USD pair exhibits a bullish impulsive pattern according to Elliott Wave analysis, indicating...

Read More >
JHX Elliott Wave Forecast: James Hardie Industries PLC Stock Analysis & ASX:JHX Price Analysis with Our Latest Technical Outlook

JHX Elliott Wave Forecast: James Hardie Industries PLC Stock Analysis & ASX:JHX Price Analysis with Our Latest Technical Outlook

Our Elliott Wave forecast for JAMES HARDIE INDUSTRIES PLC (JHX) identifies key price movements and t...

Read More >
Gain Insights into Stock Market Trends and Analysis: RUSSELL 2000 Indices Elliott Wave Technical Analysis

Gain Insights into Stock Market Trends and Analysis: RUSSELL 2000 Indices Elliott Wave Technical Analysis

Dive into our comprehensive guide on Elliott Wave Analysis and the Russell 2000 Index. Understand th...

Read More >

$1 for 2 Weeks

then $29 a month!

What a Special Offer!

Trade Recommendations

Unleash the power of deversified trading with our comprehensive portfolio, covering 250+ markets:

  • Stock Trades
  • Crypto Trades
  • Forex Trades
  • Commodity Trades
Elliott Wave Analysis

Gain a competitive edge with expert insights and AI-powered Elliott Wave charting into:

  • Global Indices
  • US Stocks & ASX Stocks
  • Forex & Crypto
  • Commodities
Top-Notch Trading Tools

Equip yourself with the tools of success:

  • Real-time Chat rooms
  • Elliott Wave Algorithm
  • Portfolio tools
  • TradingLevels
  • Screener
  • Trading Game
7 Elliott Wave Analysts

Stay ahead of the market with daily charts and insightful videos
Your secret to strategic trading!

JOIN HERE


Welcome to TradingLounge (ASIC A.R.No. 321187), specialists in trades, trading education and technical analysis, covering stocks, indices, commodities, forex and cryptocurrencies.

When you join TradingLounge you have access to everything we offer, including trade tools, educational content and a social platform to chat with like-minded investors.

Read more

@Copyright 2024 by tradinglounge.com

Contact Us

Australian no: 02 4787 6020

International no: +61 (2) 47876020

Pay with:

Find us on