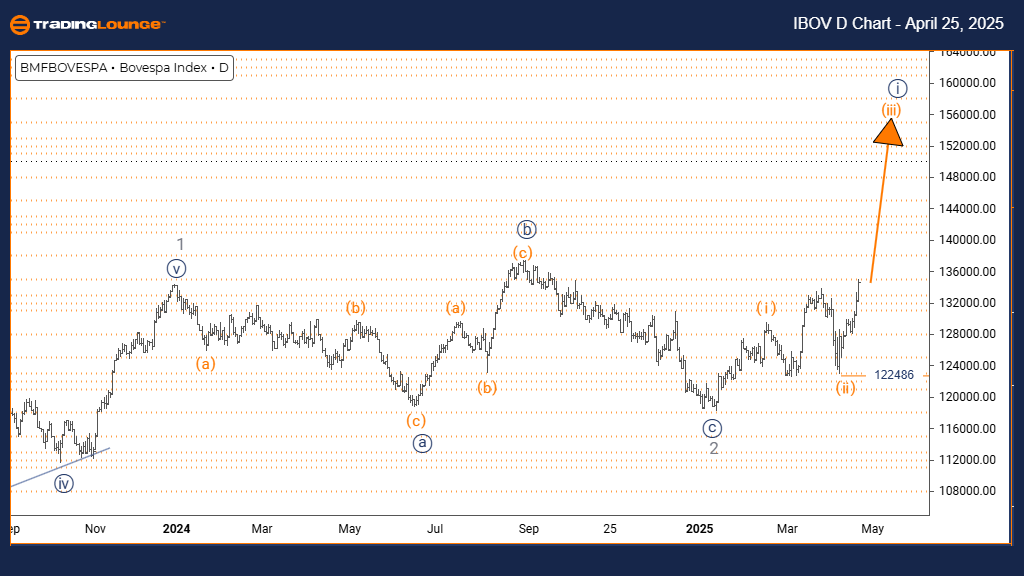
Bovespa Index Elliott Wave Analysis – TradingLounge Day Chart
Bovespa Index Daily Elliott Wave Forecast & Technical Outlook
FUNCTION: Bullish Trend
MODE: Impulsive
STRUCTURE: Orange Wave 3
POSITION: Navy Blue Wave 1
DIRECTION NEXT LOWER DEGREES: Orange Wave 4
DETAILS: Orange Wave 2 looks complete; Orange Wave 3 is unfolding.
Wave Invalidation Level: 122486
The Bovespa Index Elliott Wave daily analysis reveals a developing bullish impulsive structure. With Orange Wave 2 correction now likely complete, the index has entered Orange Wave 3, forming part of the broader Navy Blue Wave 1. This wave typically signals the strongest portion of the impulse, often accompanied by sharp rallies and increasing momentum.
Orange Wave 3 is generally the most powerful phase in an impulsive Elliott Wave pattern, usually outperforming the prior wave 1. With momentum building, the current structure suggests more upside potential before facing the next corrective phase, Orange Wave 4.
The critical wave invalidation level at 122486 serves as the key support. A break below this level would invalidate the current bullish wave count. As long as the price remains above this level, the bullish Elliott count remains valid.
Traders should monitor for wave 3 behavior such as strong momentum, rising volume, and accelerated price movement. The current setup favors bullish trades within this impulsive advance, offering potential for further gains as the structure unfolds.
When Orange Wave 3 completes, Orange Wave 4 is anticipated to bring a corrective pullback. This correction may provide a fresh long-entry opportunity before the final leg of the bullish move. Traders are encouraged to align with the trend during this wave 3 rally for optimal positioning.
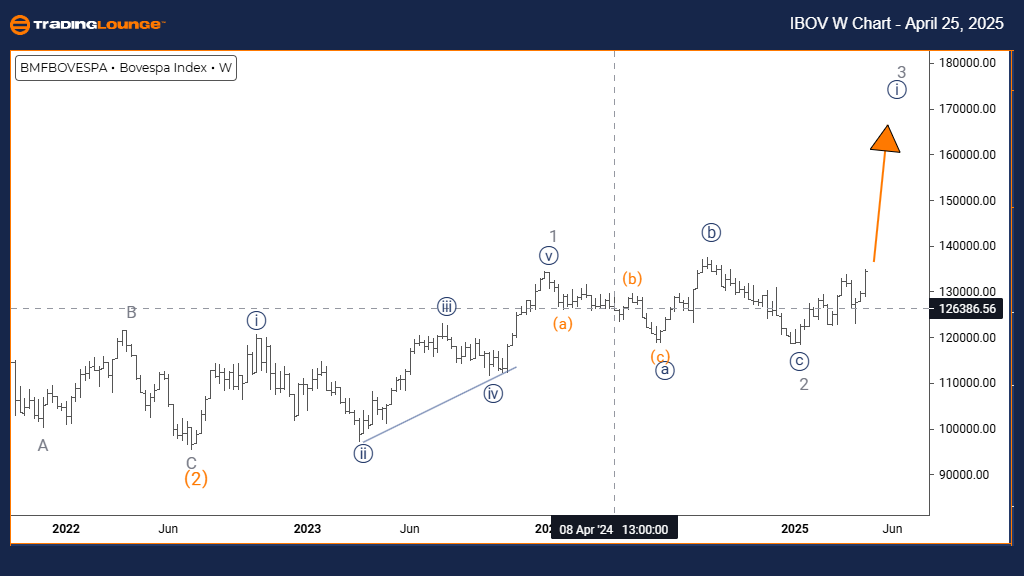
Bovespa Index Elliott Wave Analysis – TradingLounge Weekly Chart
Bovespa Index Weekly Elliott Wave Forecast & Technical Outlook
FUNCTION: Bullish Trend
MODE: Impulsive
STRUCTURE: Navy Blue Wave 1
POSITION: Gray Wave 3
DIRECTION NEXT LOWER DEGREES: Navy Blue Wave 1 (Initiated)
DETAILS: Gray Wave 2 looks complete; Navy Blue Wave 1 of Gray Wave 3 is in progress.
The Bovespa Index Elliott Wave weekly chart outlines a bullish impulsive structure currently forming. With Gray Wave 2 correction likely finished, the index has begun Navy Blue Wave 1, part of the broader Gray Wave 3 sequence. This setup signals the beginning of a new medium-term uptrend with the potential for sustained gains.
Navy Blue Wave 1 typically represents the foundation of a bullish move. It starts with measured, steady price increases as market confidence grows. Following the Gray Wave 2 bottom, this wave initiates the next major trend phase, setting the tone for further upward expansion.
The broader weekly timeframe enhances visibility of the unfolding pattern, supporting the likelihood of continued strength. Entering Gray Wave 3, a higher-degree wave, implies increased bullish potential in the coming weeks and months.
Traders should watch for classic wave 1 traits—gradual price gains, rising volume, and strengthening indicators. Though generally less aggressive than wave 3, wave 1 is crucial for establishing trend structure. Monitoring key technical signals will assist in validating the wave count as it evolves.
Upon completion of Navy Blue Wave 1, Navy Blue Wave 2 is expected to deliver a corrective phase. This pullback may present another opportunity to join the trend before a likely surge in Gray Wave 3. Overall, the current Elliott Wave setup supports a bullish bias with a favorable outlook for medium- to long-term gains.
Technical Analyst: Malik Awais
Source: Visit Tradinglounge.com and learn from the Experts. Join TradingLounge Here
Previous: CAC 40 (France) Elliott Wave Technical Analysis
VALUE Offer - Buy 1 Month & Get 3 Months!Click here
Access 7 Analysts Over 200 Markets Covered. Chat Room With Support