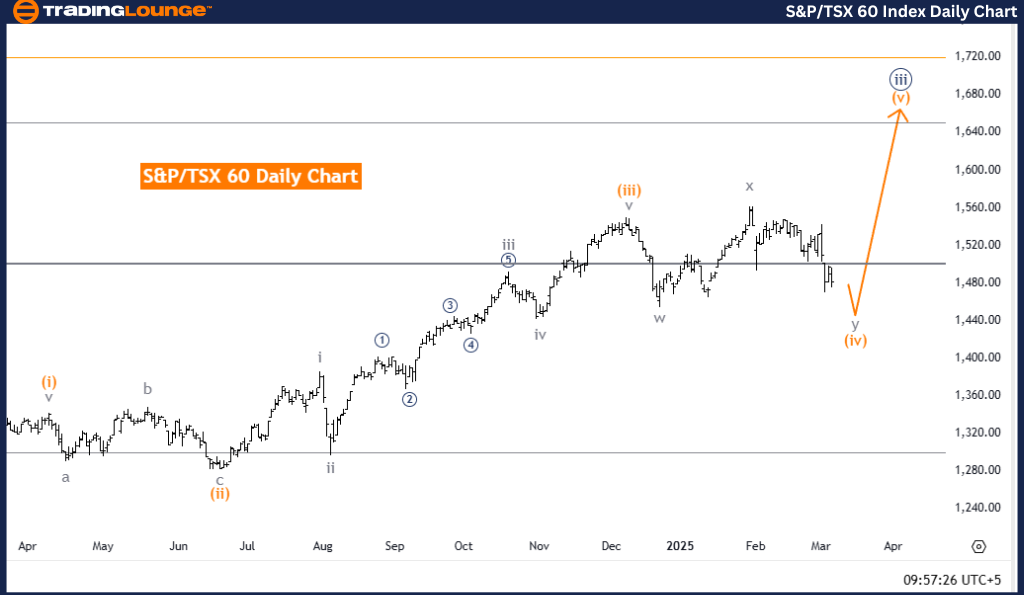
S&P/TSX 60 Elliott Wave Analysis – Trading Lounge Day Chart
S&P/TSX 60 Elliott Wave Technical Analysis
Function: Counter Trend
Mode: Corrective
Structure: Orange Wave 4
Position: Navy Blue Wave 3
Next Higher Degree Direction: Orange Wave 5
Market Overview
The S&P/TSX 60 Elliott Wave Analysis for the daily chart signals a counter-trend scenario, confirming that the market is currently in a corrective phase. The wave structure is identified as orange wave 4, forming part of the broader corrective movement within navy blue wave 3. This positioning suggests an intermediate correction before the larger uptrend resumes. The next anticipated wave movement at a higher degree is orange wave 5, expected to develop once the corrective phase of orange wave 4 concludes.
Technical Breakdown
The analysis confirms the completion of orange wave 3, with the market now transitioning into orange wave 4. This phase typically exhibits corrective characteristics, which may include sideways or downward price movements before the next impulsive wave, orange wave 5, begins. Traders should note that the completion of orange wave 4 is a crucial event, as it will indicate the potential start of the next bullish wave, aligning with the broader Elliott Wave structure.
Conclusion
The S&P/TSX 60 Index remains in a corrective phase within its Elliott Wave cycle, with orange wave 4 currently in play following the completion of orange wave 3. As part of navy blue wave 3, this correction is a key development before the market resumes its primary trend with orange wave 5.
Traders should carefully observe the completion of orange wave 4, as it will provide valuable insights into market direction and timing. Understanding the Elliott Wave structure is essential for anticipating price action and optimizing trading strategies accordingly.
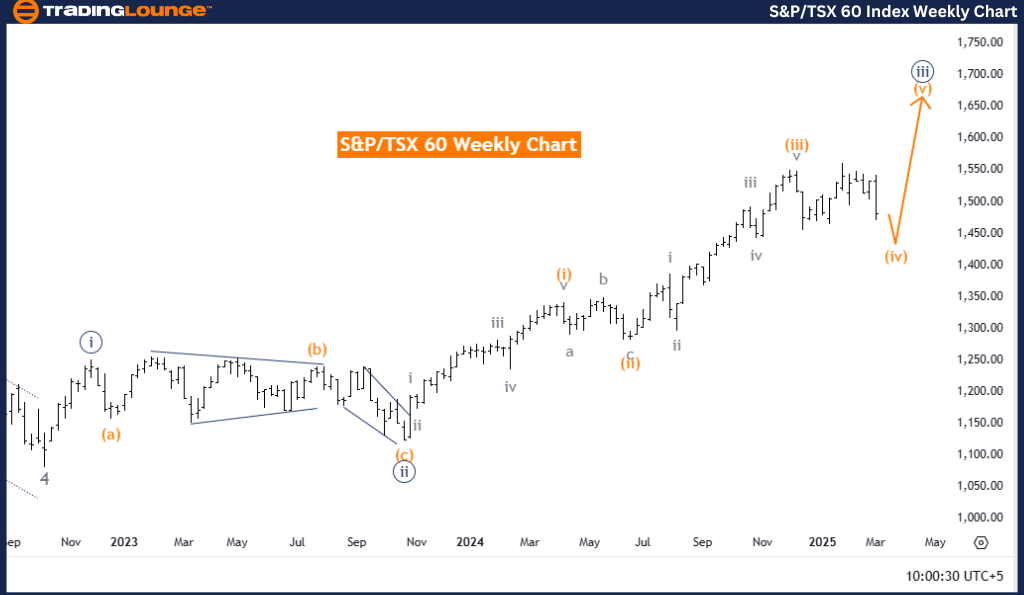
S&P/TSX 60 Elliott Wave Analysis – Trading Lounge Weekly Chart
S&P/TSX 60 Elliott Wave Technical Analysis
Function: Counter Trend
Mode: Corrective
Structure: Orange Wave 4
Position: Navy Blue Wave 3
Next Higher Degree Direction: Orange Wave 5
Market Overview
The S&P/TSX 60 Elliott Wave Analysis for the weekly chart continues to reflect a counter-trend scenario, indicating that the market is still in a corrective phase. The wave structure is identified as orange wave 4, part of a larger corrective pattern within navy blue wave 3. This setup suggests that the market is undergoing an intermediate correction before resuming its broader bullish trend. The next projected movement at a higher degree is orange wave 5, anticipated to develop once the orange wave 4 correction finalizes.
Technical Breakdown
The market has completed orange wave 3 and is now moving into orange wave 4, which is expected to display corrective characteristics such as sideways or downward price movements. This phase serves as a necessary consolidation before the next impulsive advance, orange wave 5, begins. The completion of orange wave 4 is a key inflection point for traders, as it will signal the potential start of a renewed uptrend within the Elliott Wave framework.
Conclusion
The S&P/TSX 60 Index remains in a corrective phase, with orange wave 4 actively developing after orange wave 3's completion. This corrective movement is part of navy blue wave 3, and the next significant market event is expected to be orange wave 5, marking the next impulsive upward move.
Traders should monitor orange wave 4 closely, as its completion will offer crucial insights into market timing and directional momentum. A strong understanding of Elliott Wave structures can help traders anticipate price trends and fine-tune their trading strategies for optimal execution.
Technical Analyst: Malik Awais
Source: visit Tradinglounge.com and learn From the Experts Join TradingLounge Here
Previous: NIFTY 50 INDEX Elliott Wave Technical Analysis
VALUE Offer - Buy 1 Month & Get 3 Months!Click here
Access 7 Analysts Over 200 Markets Covered. Chat Room With Support