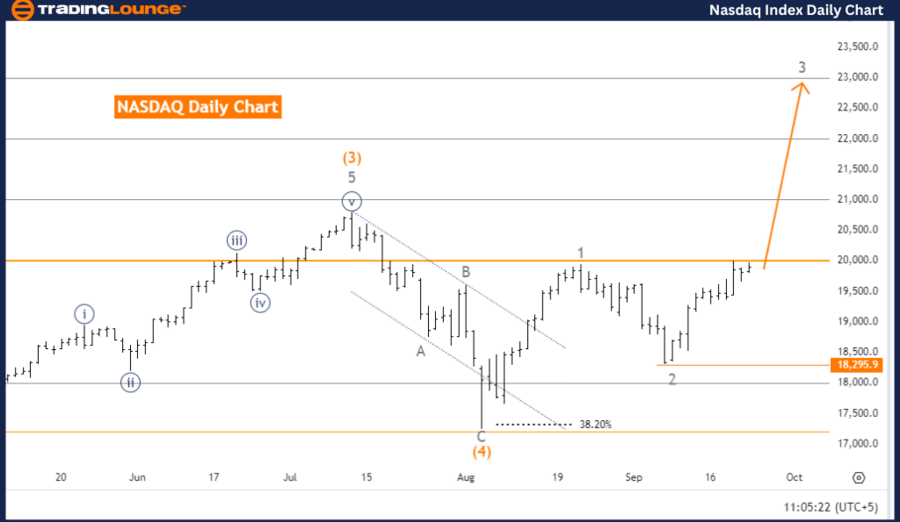
NASDAQ Elliott Wave Analysis Trading Lounge Day Chart
NASDAQ Index Daily Chart Analysis
NASDAQ Elliott Wave Technical Analysis
-
Function: Bullish Trend
-
Mode: Impulsive
-
Structure: Gray Wave 3
-
Position: Orange Wave 5
-
Next Lower Degree Movement: Gray Wave 4
-
Details: Gray Wave 2 completed, Gray Wave 3 of Orange Wave 5 in progress
- Wave Cancel Invalid Level: 18,295.9
The NASDAQ Elliott Wave analysis on the daily chart points to a bullish trend, with the market progressing in an impulsive mode. The current price action is part of gray wave 3, signaling strong upward momentum in the broader sequence. This indicates that the bullish trend remains intact.
The market is now within orange wave 5, which often marks the final wave of a smaller sequence within a larger trend. This phase typically leads to further price increases before a corrective movement. Following the completion of orange wave 5, a correction is expected in the form of gray wave 4, signaling the next lower degree movement.
The analysis shows gray wave 2 has finished, and the market is now advancing in gray wave 3 of orange wave 5. This reinforces the upward momentum, confirming that prices are still rising as part of the ongoing bullish trend. With the conclusion of gray wave 2, the corrective phase has ended, and the focus is now on the progression of gray wave 3.
The wave cancel invalidation level is set at 18,295.9. If the price dips below this level, the current wave count and structure will be invalidated, necessitating a reassessment of the market trend.
Summary
The NASDAQ is in a bullish trend, with gray wave 3 of orange wave 5 currently underway. As long as the price remains above 18,295.9, the upward trend is expected to continue. A correction may occur once gray wave 4 begins.
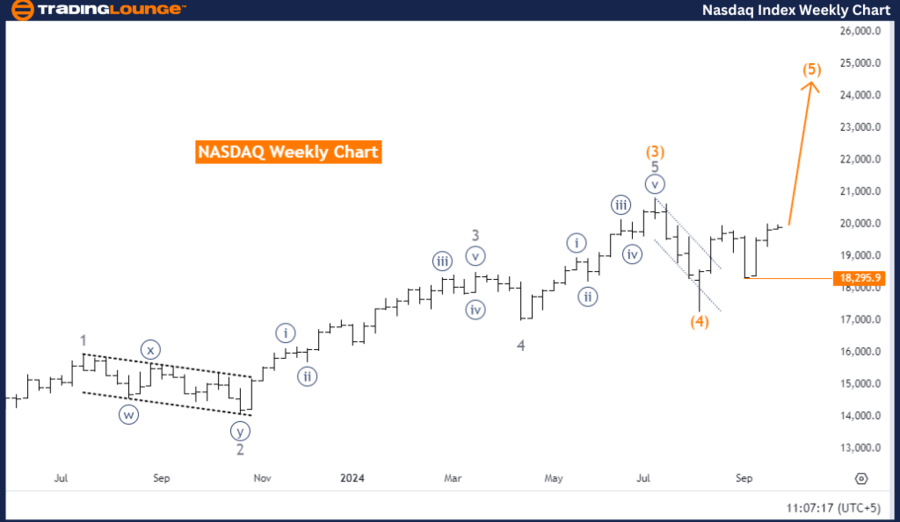
NASDAQ Elliott Wave Analysis Trading Lounge Weekly Chart
NASDAQ Elliott Wave Technical Analysis
-
Function: Bullish Trend
-
Mode: Impulsive
-
Structure: Orange Wave 5
-
Next Higher Degree Movement: Orange Wave 5 (Started)
-
Details: Orange Wave 4 completed, Orange Wave 5 in progress
- Wave Cancel Invalid Level: 18,295.9
The NASDAQ Elliott Wave analysis on the weekly chart also confirms a bullish trend, with the market advancing in an impulsive mode. The primary structure at play is orange wave 5, suggesting the market is in the final wave of a larger upward trend. This ongoing bullish wave indicates further price increases in the near term.
The analysis confirms that orange wave 4 has already concluded, ending the previous corrective phase. The market is now in orange wave 5, which represents the continuation of the bullish trend. As orange wave 5 progresses, this is typically the last phase in an impulse wave sequence, meaning a larger corrective phase may follow its completion.
The next higher degree movement indicates that orange wave 5 has already started, confirming that the market is advancing in this final bullish leg. As long as the price stays above 18,295.9, the upward trend should continue. If the price falls below this level, the current wave structure will be invalidated, and the market trend will need to be reassessed.
Summary
The NASDAQ weekly chart indicates a bullish trend, with orange wave 5 currently unfolding. This wave suggests that the upward movement will continue within the impulsive structure. As long as the price remains above 18,295.9, the bullish trend is expected to persist. After Orange Wave 5 concludes, a larger market correction may take place.
Technical Analyst: Malik Awais
Source: visit Tradinglounge.com and learn From the Experts Join TradingLounge Here
Previous: Bovespa Index Elliott Wave Technical Analysis
VALUE Offer - Buy 1 Month & Get 3 Months!Click here
Access 7 Analysts Over 200 Markets Covered. Chat Room With Support