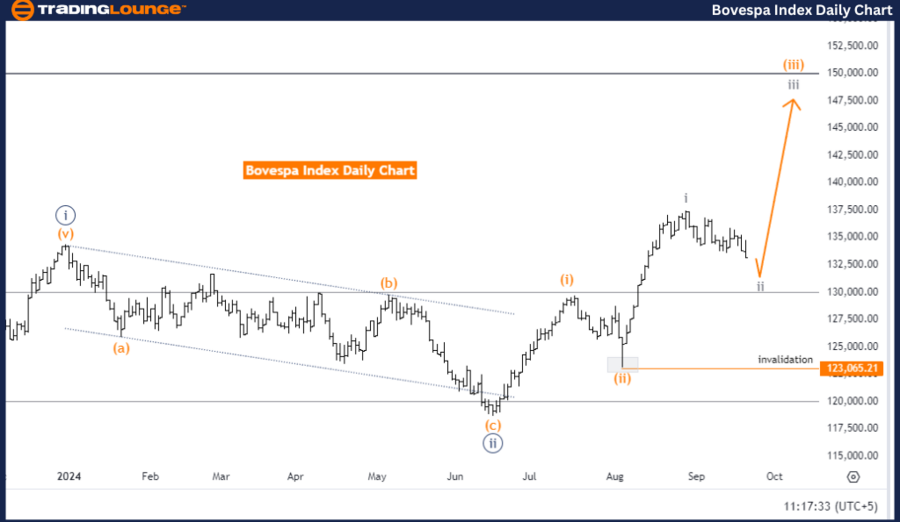
Bovespa Index Elliott Wave Analysis - Trading Lounge Day Chart
Bovespa Index Elliott Wave Technical Analysis
FUNCTION: Counter Trend
MODE: Corrective
STRUCTURE: Gray Wave 2
POSITION: Orange Wave 3
DIRECTION NEXT HIGHER DEGREES: Gray Wave 3
DETAILS: Gray wave 1 appears to have completed, and gray wave 2 is currently in play.
Wave Cancel Invalid Level: 123065.21
The Elliott Wave analysis for the daily chart of the Bovespa Index suggests that the market is currently in a counter-trend phase, indicating a price movement against the broader trend. This corrective mode points to a temporary pullback before the resumption of the main trend.
Currently, the market is in gray wave 2, part of the overall correction. The market's position in orange wave 3 indicates that after this corrective phase ends, an upward trend is anticipated. The next significant movement aligns with gray wave 3, expected to continue the bullish trajectory once gray wave 2 completes.
Gray wave 1 has finished, with gray wave 2 now in progress, signaling a retracement after the upward movement of wave 1. The wave count becomes invalid if the price falls below 123065.21, requiring a re-evaluation of the analysis.
Conclusion:
The Bovespa Index is undergoing a corrective phase in gray wave 2 following the completion of gray wave 1. Once this phase ends, the market is expected to resume upward momentum into orange wave 3 and eventually gray wave 3. This analysis holds as long as the price stays above 123065.21.
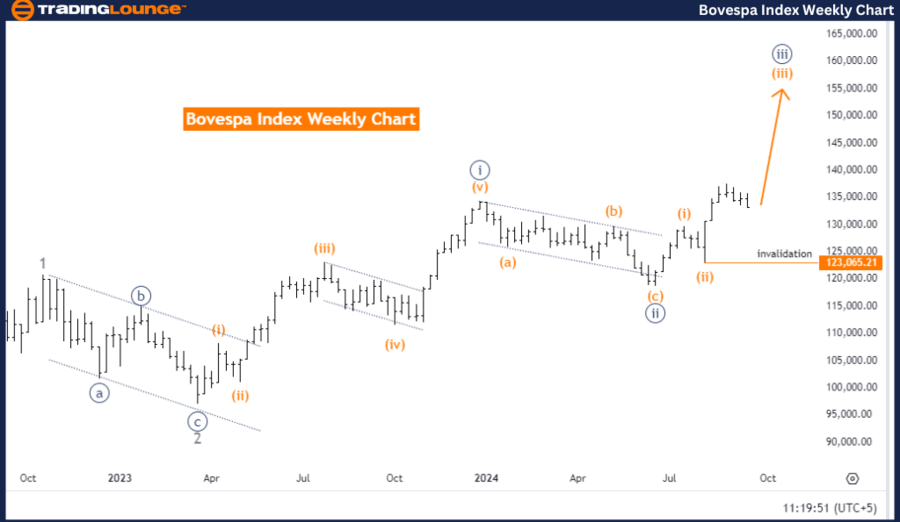
Bovespa Index Elliott Wave Analysis - Trading Lounge Weekly Chart
Bovespa Index Elliott Wave Technical Analysis
FUNCTION: Bullish Trend
MODE: Impulsive
STRUCTURE: Orange Wave 3
POSITION: Navy Blue Wave 3
DIRECTION NEXT HIGHER DEGREES: Orange Wave 3 (Started)
DETAILS: Orange wave 2 appears to have been completed, and now orange wave 3 is in progress.
Wave Cancel Invalid Level: 123065.21
The Elliott Wave analysis for the weekly chart of the Bovespa Index reveals that the market is in a bullish trend, with strong upward momentum. The analysis is in impulsive mode, highlighting that the market is moving in alignment with the dominant trend, driven by strength and momentum.
The current structure under review is orange wave 3, which confirms the bullish direction. The market is in navy blue wave 3, indicating that the upward movement is ongoing and part of the broader orange wave 3 structure. This signals continued upside potential as the market advances within this wave.
Orange wave 2 has concluded, marking the end of the corrective phase. The market is now progressing in orange wave 3, a strong upward move that aligns with the ongoing bullish trend. If the price falls below 123065.21, the current wave structure will be invalidated and require reanalysis.
Summary:
The Bovespa Index is in a bullish phase, with orange wave 3 currently advancing after the completion of orange wave 2. The market is expected to continue its upward movement, progressing through navy blue wave 3. This analysis is valid as long as the price remains above 123065.21, supporting the continuation of the bullish trend.
Technical Analyst: Malik Awais
Source: visit Tradinglounge.com and learn From the Experts Join TradingLounge Here
Previous: Euro Stoxx 50 Elliott Wave Technical Analysis
VALUE Offer - Buy 1 Month & Get 3 Months!Click here
Access 7 Analysts Over 200 Markets Covered. Chat Room With Support