Elliott Wave Analysis of WTI Crude Oil: Bearish Trends and Key Levels to Watch

WTI Elliott wave analysis 
Function - Counter-trend 
Mode - Corrective 
Structure - Impulse for wave 1
Position - Wave 1
Direction - Wave 1 is still in play
Details - Price could currently be in the blue wave ‘iv’ bounce or 2nd sub-wave of blue wave ‘iii’. The two scenarios support an extension lower for as much as the price remains below 81.07.

Since April 2024, the West Texas Intermediate (WTI) crude oil market has been descending into an impulse wave. This indicates that the recovery from the December 2023 low has likely concluded, and prices may extend lower, potentially falling below that previous low in the coming weeks. The long-term outlook for WTI remains bearish. With medium-term price movements now aligning with this outlook, it might be prudent for buyers to reconsider their positions and switch sides on this commodity.

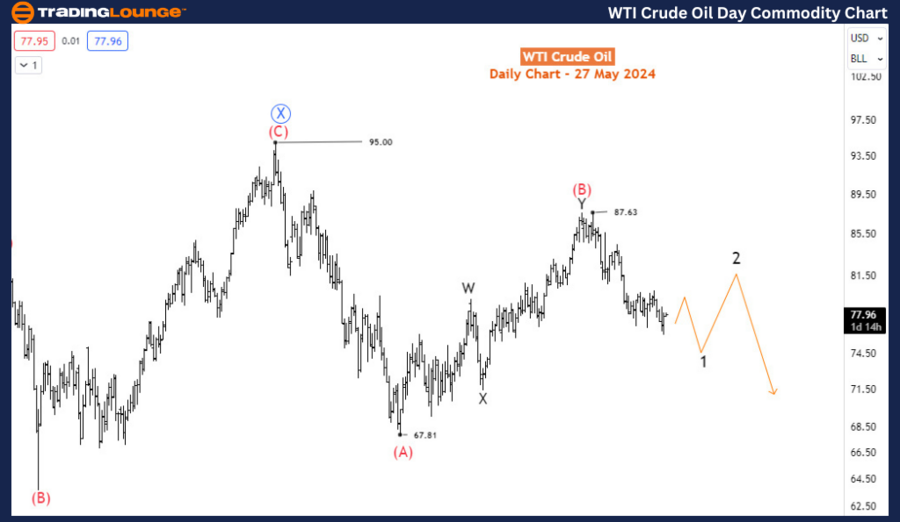
Analyzing the daily chart,

The blue wave X of the primary degree reached its peak at 95 in September 2023. Prior to this, the preceding blue wave W commenced at 130.9 in March 2022 and concluded with a double zigzag structure at 64.56 in March 2023. From the peak at 95, we have been tracking the blue wave Y, which subdivides into an (A)-(B)-(C) zigzag pattern. The high of 87.63 confirmed wave (B), and the current decline is part of wave (C). The impulse wave declining from 87.63 can be identified as wave 1 of (C). This decline has been further detailed on the H4 chart.
WTI-Crude-Oil-daily-...


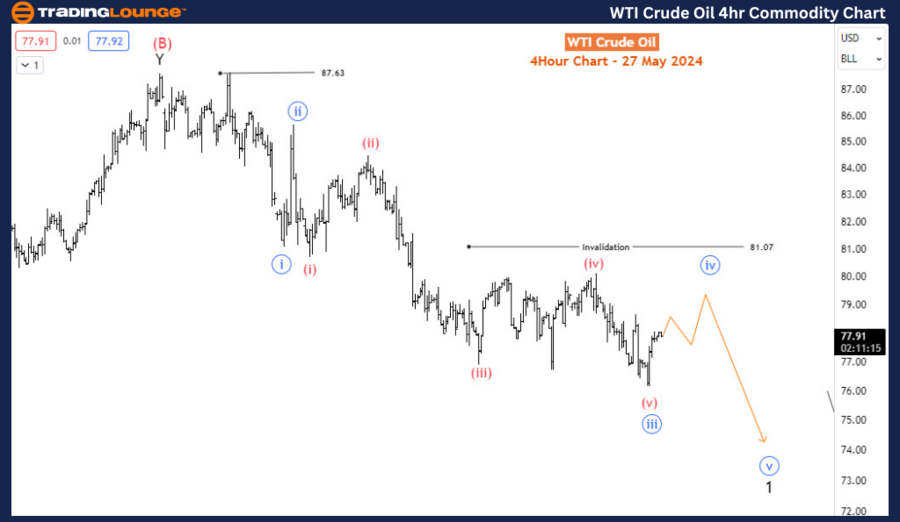
Examining the H4 Chart

On the H4 chart, the price action is currently undergoing an upward correction within blue wave iv of 1. If the price remains below 81.07, we can anticipate further selling pressure, which would complete blue wave v of 1 before a more significant corrective bounce in wave 2 begins. However, if the ongoing minor recovery surpasses 81.07, it would suggest that wave 1 has already concluded, and the price is now in wave 2. The ultimate invalidation point for this analysis is at 87.63; as long as prices remain below this level, sellers should maintain control in the medium term.

Conclusion:

To summarize, the WTI crude oil market's recent price movements suggest a continuation of the downtrend initiated in April 2024. The completion of the recovery phase from the December 2023 low, coupled with the formation of an impulse wave, points towards further downside potential. Traders should closely monitor the key levels of 81.07 and 87.63 to confirm the ongoing wave structure and make informed trading decisions. As long as the price stays below 87.63, the bearish outlook remains valid, and sellers are likely to dominate in the medium term.

Technical Analyst: Sanmi Adeagbo

Source: visit Tradinglounge.com and learn From the Experts Join TradingLounge Here 

See Previous: Gold (XAUUSD) Elliott Wave Analysis

Special Trial Offer - 0.76 Cents a Day for 3 Months! Click here

Access 7 Analysts Over 170 Markets Covered. Chat Room With Support
WTI-Crude-Oil-4Hr-Co...

Related

Maximize Your Trading Success: Expert Elliott Wave Analysis for NASDAQ and Top Tech Stocks

Maximize Your Trading Success: Expert Elliott Wave Analysis for NASDAQ and Top Tech Stocks

This content revolves around providing advanced Elliott Wave analysis and trading strategies for the...

Read More >
Britannia Industries Elliott Wave Technical Analysis: Price Prediction, Support & Resistance Levels and Share Price Forecast

Britannia Industries Elliott Wave Technical Analysis: Price Prediction, Support & Resistance Levels and Share Price Forecast

Britannia Industries has undergone a significant five-wave impulse decline from its 6450 high. A cor...

Read More >
DAX (Germany) Index Wave Technical Analysis: Highlights Key Support at 18530 Amid Strong Upward Market Momentum

DAX (Germany) Index Wave Technical Analysis: Highlights Key Support at 18530 Amid Strong Upward Market Momentum

The DAX index is exhibiting a bullish impulsive Wave 3, suggesting strong upward momentum. Key suppo...

Read More >
ASX: Santos Limited (STO) Stock Analysis & Elliott Wave Technical Forecast with Key Trends and Actionable Trading Strategies

ASX: Santos Limited (STO) Stock Analysis & Elliott Wave Technical Forecast with Key Trends and Actionable Trading Strategies

Get detailed Elliott Wave analysis for ASX: SANTOS LIMITED (STO), including stock trends, price pred...

Read More >
Snowflake SNOW Elliott Wave Bullish Analysis: Daily Wave V & Weekly Wave III Forecasts Offer High‑Probability Trading Setup

Snowflake SNOW Elliott Wave Bullish Analysis: Daily Wave V & Weekly Wave III Forecasts Offer High‑Probability Trading Setup

Snowflake Inc. (SNOW) shows a bullish Elliott Wave structure: daily Wave V targets a move equal to W...

Read More >
VeChain Elliott Wave Forecast: VETUSD Buy Zone, Wave III Potential, Risk Alert, and Price Prediction for Swing Traders

VeChain Elliott Wave Forecast: VETUSD Buy Zone, Wave III Potential, Risk Alert, and Price Prediction for Swing Traders

This post breaks down VeChain's (VETUSD) price movement using Elliott Wave analysis, highlights ...

Read More >

$1 for 2 Weeks

then $29 a month!

What a Special Offer!

Trade Recommendations

Unleash the power of deversified trading with our comprehensive portfolio, covering 250+ markets:

  • Stock Trades
  • Crypto Trades
  • Forex Trades
  • Commodity Trades
Elliott Wave Analysis

Gain a competitive edge with expert insights and AI-powered Elliott Wave charting into:

  • Global Indices
  • US Stocks & ASX Stocks
  • Forex & Crypto
  • Commodities
Top-Notch Trading Tools

Equip yourself with the tools of success:

  • Real-time Chat rooms
  • Elliott Wave Algorithm
  • Portfolio tools
  • TradingLevels
  • Screener
  • Trading Game
7 Elliott Wave Analysts

Stay ahead of the market with daily charts and insightful videos
Your secret to strategic trading!

JOIN HERE


Welcome to TradingLounge (ASIC A.R.No. 321187), specialists in trades, trading education and technical analysis, covering stocks, indices, commodities, forex and cryptocurrencies.

When you join TradingLounge you have access to everything we offer, including trade tools, educational content and a social platform to chat with like-minded investors.

Read more

@Copyright 2024 by tradinglounge.com

Contact Us

Australian no: 02 4787 6020

International no: +61 (2) 47876020

Pay with:

Find us on