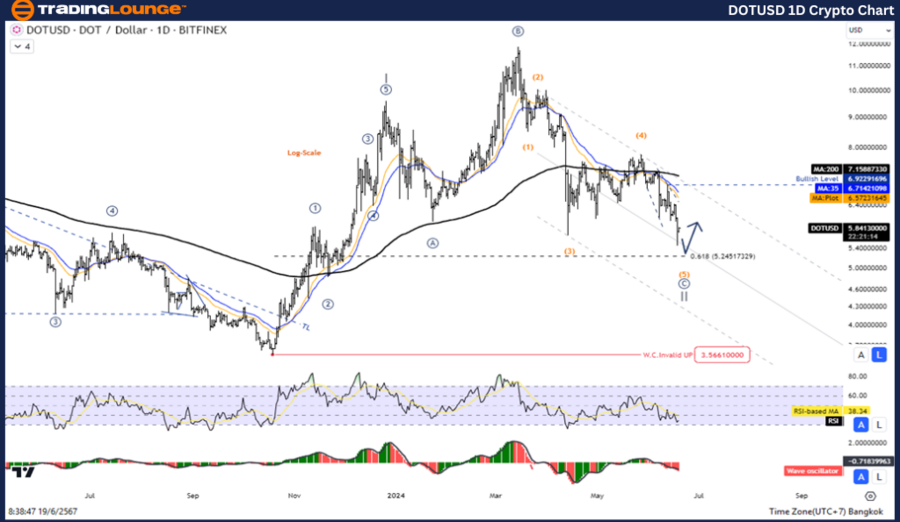
DOTUSD Elliott Wave Analysis TradingLounge Daily Chart

Polkadot/ U.S. dollar (DOTUSD) Daily Chart Analysis

DOTUSD Elliott Wave Technical Analysis

Function: Counter Trend

Mode: Corrective

Structure: Flat

Position: Wave C

Direction Next Higher Degrees: Wave (II) of Impulse

Wave Cancel Invalid Level:

Details: Wave II is equal to 61.8% of Wave I at 5.225

Polkadot/ U.S. dollar (DOTUSD) Trading Strategy:
Polkadot is currently in a correction phase. Positioned in wave (II) with a double corrective pattern, a short-term pullback is expected before wave (III) rises. Traders should wait for the correction to finish to rejoin the uptrend.

Polkadot/ U.S. dollar (DOTUSD) Technical Indicators:

  • Price is below the MA200, indicating a downtrend.
  • The Wave Oscillator shows Bearish Momentum.

DOTUSD-1D-Crypto-Cha...


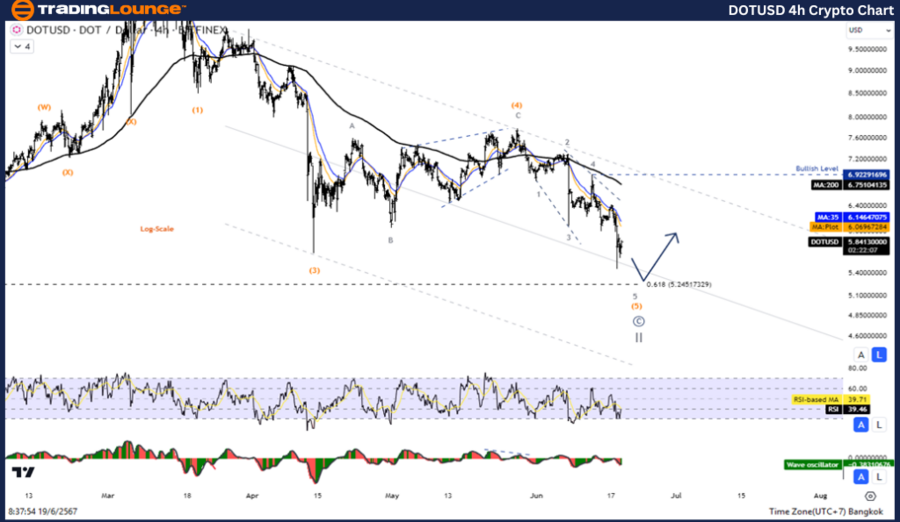
DOTUSD Elliott Wave Analysis TradingLounge H4 Chart

Polkadot/ U.S. dollar (DOTUSD) 4-Hour Chart Analysis

DOTUSD Elliott Wave Technical Analysis

Function: Counter Trend

Mode: Corrective

Structure: Flat

Position: Wave C

Direction Next Higher Degrees: Wave (II) of Impulse

Wave Cancel Invalid Level:

Details: Wave II is equal to 61.8% of Wave I at 5.225

Polkadot/ U.S. dollar (DOTUSD) Trading Strategy:
Polkadot is currently in a correction phase. Positioned in wave (II) with a double corrective pattern, a short-term pullback is expected before wave (III) rises. Traders should wait for the correction to finish to rejoin the uptrend.

Polkadot/ U.S. dollar (DOTUSD) Technical Indicators:

  • Price is below the MA200, indicating a downtrend.
  • The Wave Oscillator shows Bearish Momentum.

Technical Analyst:  Kittiampon Somboonsod

Source: visit Tradinglounge.com and learn From the Experts Join TradingLounge Here 

See Previous: ChainLink/U.S. Dollar (LINKUSD Elliott Wave Technical Analysis

Special Trial Offer - 0.76 Cents a Day for 3 Months! Click here

Access 7 Analysts Over 170 Markets Covered. Chat Room With Support

DOTUSD-4h-Crypto-Cha...

Related

WTI Crudeoil Elliott Wave Analysis: Crude Oil Price Forecast, Support & Resistance Levels, and Trading Strategy Insights

WTI Crudeoil Elliott Wave Analysis: Crude Oil Price Forecast, Support & Resistance Levels, and Trading Strategy Insights

WTI Elliott Wave analysis of crude oil price trends and potential movements based on technical chart...

Read More >
Wheat Commodity Elliott Wave Technical Analysis: Bullish Corrections and Future Price Movements in Wheat Futures

Wheat Commodity Elliott Wave Technical Analysis: Bullish Corrections and Future Price Movements in Wheat Futures

Our latest wheat price forecast for 2024 is based on Elliott Wave analysis, highlighting key market ...

Read More >
S&P/TSX 60 Index Elliott Wave Technical Analysis Shows Reinforcing the overall Bullish Outlook in both Daily and Weekly Charts

S&P/TSX 60 Index Elliott Wave Technical Analysis Shows Reinforcing the overall Bullish Outlook in both Daily and Weekly Charts

The S&P/TSX 60 is in a bullish trend, according to Elliott Wave analysis. Gray wave 2 of orange wave...

Read More >
Silver Price Forecast for 2024: Elliott Wave Technical Analysis, Bullish Trends, Key Price Levels, and Market Movement Insights

Silver Price Forecast for 2024: Elliott Wave Technical Analysis, Bullish Trends, Key Price Levels, and Market Movement Insights

This article delves into a comprehensive Silver price forecast for 2024 using Elliott Wave analysis....

Read More >
Master Soybean Commodity Trends: Elliott Wave Technical Analysis for Precise Futures Market with Actionable Insights

Master Soybean Commodity Trends: Elliott Wave Technical Analysis for Precise Futures Market with Actionable Insights

Get a comprehensive view of soybean market trends with our detailed Elliott Wave analysis. Learn abo...

Read More >
NIFTY 50 (India) Elliott Wave Technical Analysis: Insights into Corrective Waves, Invalidation Levels, and Key Market Trends for Traders

NIFTY 50 (India) Elliott Wave Technical Analysis: Insights into Corrective Waves, Invalidation Levels, and Key Market Trends for Traders

Get a comprehensive overview of NIFTY 50 Elliott Wave analysis, covering daily and weekly chart insi...

Read More >

Buy 1 Month

Get 3 Months!

Special Offer:

Trade Recommendations

Unleash the power of deversified trading with our comprehensive portfolio, covering:

  • Stock Trades
  • Crypto Trades
  • Forex Trades
  • Commodity Trades
Elliott Wave Analysis

Gain a competive edge with expert insights in to:

  • Global Indices
  • US Stocks & ASX Stocks
  • Forex & Crypto
  • Commodities
Top-Notch Trading Tools

Equip yourself with the tools of success:

  • Social Chat
  • Elliott Wave Algorithm
  • Screener
  • TradingLevels
  • Trading Game
7 Elliott Wave Analysts

Stay ahead of the market with daily charts and insightful videos
-Your secret to strategic trading!

JOIN HERE


Welcome to TradingLounge (ASIC A.R.No. 321187), specialists in trades, trading education and technical analysis, covering stocks, indices, commodities, forex and cryptocurrencies.

When you join TradingLounge you have access to everything we offer, including trade tools, educational content and a social platform to chat with like-minded investors.

Read more

@Copyright 2024 by tradinglounge.com

Contact Us

Australian no: 02 4787 6020

International no: +61 (2) 47876020

Pay with:

Find us on