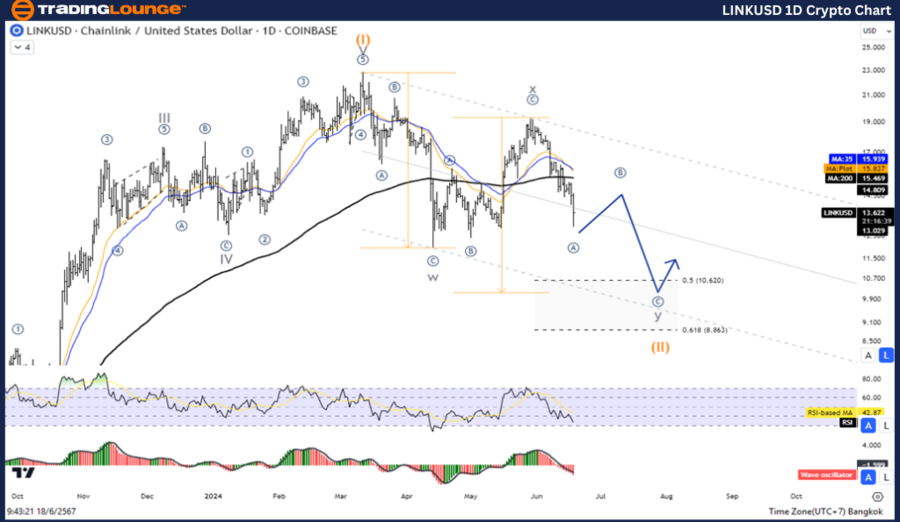
LINKUSD Elliott Wave Analysis TradingLounge Daily Chart
ChainLink/U.S. Dollar (LINKUSD) Daily Chart Analysis
LINKUSD Elliott Wave Technical Analysis
Function: Counter Trend
Mode: Corrective
Structure: Double Corrective
Position: Wave Y
Direction Next Higher Degrees: Wave ((II)) of Impulse
Wave Cancel Invalid Level: 8.498
Details: Wave (II) is equal to 61.8% of Wave (I) at the 8.86 Level
ChainLink/U.S. Dollar (LINKUSD) Trading Strategy:
ChainLink overall is still in a correction period. In the position of wave (II) with a double corrective pattern, the view is for a short-term pullback before rising again in wave (III). Waiting for the correction to complete to rejoin the uptrend is advisable.
ChainLink/U.S. Dollar (LINKUSD) Technical Indicators:
- The price is below the MA200, indicating a downtrend.
- The Wave Oscillator shows Bearish Momentum.

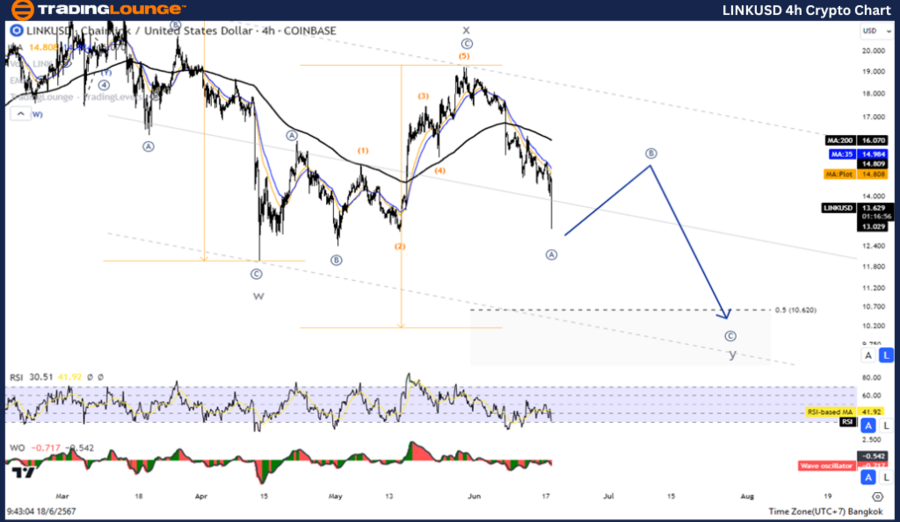
LINKUSD Elliott Wave Analysis TradingLounge 4H Chart
ChainLink/U.S. Dollar 4H Chart Analysis
LINKUSD Elliott Wave Technical Analysis
Function: Counter Trend
Mode: Corrective
Structure: Double Corrective
Position: Wave Y
Direction Next Higher Degrees: Wave ((II)) of Impulse
Wave Cancel Invalid Level: 8.498
Details: Wave (II) is equal to 61.8% of Wave (I) at the 8.86 Level
ChainLink/U.S. Dollar (LINKUSD) Trading Strategy:
ChainLink overall is still in a correction period. In the position of wave (II) with a double corrective pattern, the view is for a short-term pullback before rising again in wave (III). Waiting for the correction to complete to rejoin the uptrend is advisable.
ChainLink/U.S. Dollar (LINKUSD) Technical Indicators:
- The price is below the MA200, indicating a downtrend.
- The Wave Oscillator shows Bearish Momentum.
Technical Analyst: Kittiampon Somboonsod
Source: visit Tradinglounge.com and learn From the Experts Join TradingLounge Here
See Previous: Ethereum/ U.S. dollar (ETHUSD) Elliott Wave Technical Analysis
Special Trial Offer - 0.76 Cents a Day for 3 Months! Click here
Access 7 Analysts Over 170 Markets Covered. Chat Room With Support
