ASX: BHP GROUP LIMITED - BHP Elliott Wave Technical Analysis
Our updated Elliott Wave forecast for BHP GROUP LIMITED (ASX: BHP) highlights a potentially bullish setup as wave 3 (navy) appears to be forming. This analysis presents a short-term trading outlook, possible trend continuation, strategic buying zones, and key invalidation levels for the upward structure.
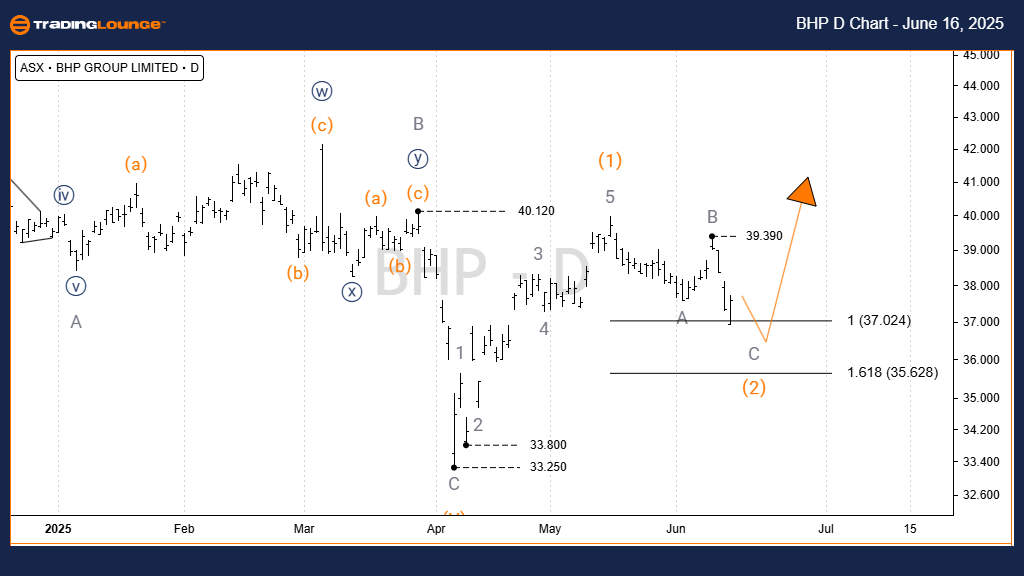
ASX: BHP GROUP LIMITED - BHP 1D Chart (Semilog Scale) Technical Analysis
Function: Major Trend (Intermediate Degree, Orange)
Mode: Motive
Structure: Impulse
Position: Wave 3) - Orange
Key Technical Insights:
The prior corrective wave 2)) - navy looks complete, setting the stage for a developing wave 3)) - navy.
Currently, wave 3)) - navy subdivides into wave 3) - orange, aiming toward the $40.00 resistance zone.
A corrective pullback in wave 2) - orange might revisit support near $37.024 – $35.628.
A confirmed breakout above $39.390 would validate the next bullish impulse phase of wave 3) - orange.
Invalidation Level: $33.25
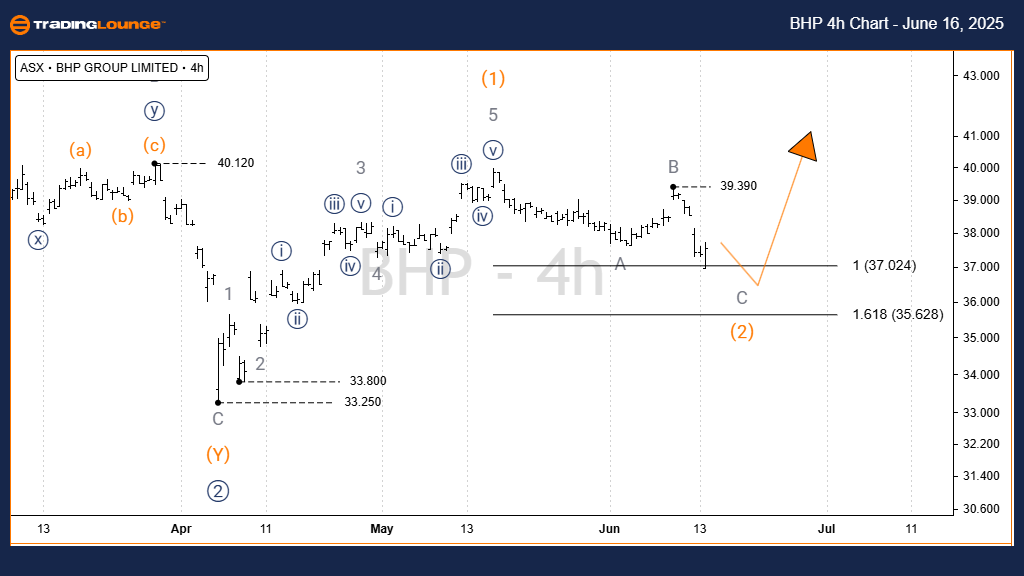
ASX: BHP GROUP LIMITED - BHP 4-Hour Chart Technical Overview
Function: Major Trend (Intermediate Degree, Orange)
Mode: Motive
Structure: Impulse
Position: Wave 3) - Orange
Technical Breakdown:
Wave 2) - orange is nearing its final stages, forming a clear A-B-C correction (grey).
Wave C - grey approaches a critical reversal zone between $37.024 and $35.628.
A strong upward move from this range, followed by a breakout past $39.390, would confirm the bullish wave 3) - orange.
Invalidation Level: $84.83
Technical Analyst: Hua (Shane) Cuong, CEWA-M (Master’s Designation).
Source: Visit Tradinglounge.com and learn from the Experts. Join TradingLounge Here
See Previous: NEWMONT CORPORATION - NEM Elliott Wave Technical Analysis
VALUE Offer - $1 for 2 Weeks then $29 a month!Click here
Access 7 Analysts Over 200 Markets Covered. Chat Room With Support
Conclusion
This Elliott Wave analysis for ASX: BHP GROUP LIMITED (BHP) provides a strategic outlook on price action, highlighting bullish wave development and key price markers. The outlined levels are essential for identifying breakout confirmation or invalidation. Traders can leverage this forecast to refine their short-term strategies and manage risk more effectively.