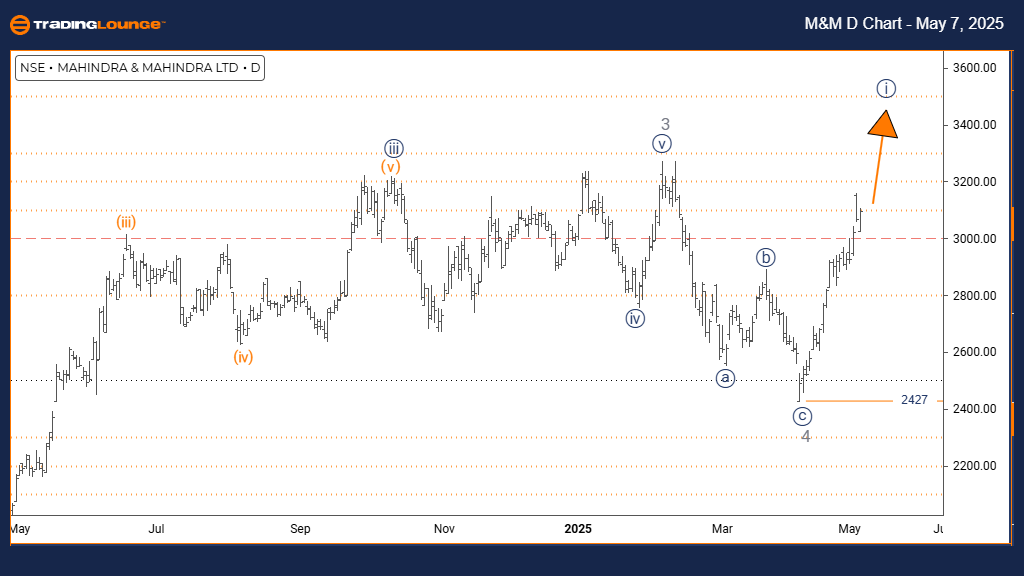
MAHINDRA & MAHINDRA - Elliott Wave Analysis - Trading Lounge Day Chart
MAHINDRA & MAHINDRA Elliott Wave Technical Analysis
FUNCTION: Bullish Trend
MODE: Impulsive
STRUCTURE: Navy Blue Wave 1
POSITION: Gray Wave 5
DIRECTION NEXT LOWER DEGREES: Navy Blue Wave 2
DETAILS: Gray Wave 4 appears complete; Navy Blue Wave 1 within Gray Wave 5 is developing.
Wave Cancel/Invalid Level: 2427
The Mahindra & Mahindra daily chart displays a clear bullish trend, progressing within an impulsive Elliott Wave framework. After completing the Gray Wave 4 correction, the stock has initiated Navy Blue Wave 1 inside the larger Gray Wave 5 sequence. This formation indicates the early phase of what could be the final rally before a more significant pullback.
The beginning of Navy Blue Wave 1 signals renewed bullish momentum, typically featuring increasing strength as prices push higher. The completion of Gray Wave 4 provided the base for this new wave, commonly leading to notable price gains before the uptrend concludes. Current wave dynamics imply more upside ahead before any meaningful correction emerges.
The critical support to monitor is 2427. If the price drops below this level, it will invalidate the current bullish wave structure, necessitating a fresh analysis. Maintaining this support is key to sustaining the bullish outlook.
On the daily timeframe, a new impulse wave appears to be gathering strength. Traders should track classic bullish signs like rising volume and steady price advances, while also preparing for the possible end of the current cycle.
Technical indicators and price behavior will be vital to confirm wave progress. As Gray Wave 5 progresses, traders should watch for signals of trend exhaustion, including divergence on momentum tools.
Following the completion of Navy Blue Wave 1, the market is expected to enter Navy Blue Wave 2, offering a pullback opportunity. This correction could present a strategic entry point for traders aiming to participate in the final leg of the Gray Wave 5 bullish trend.
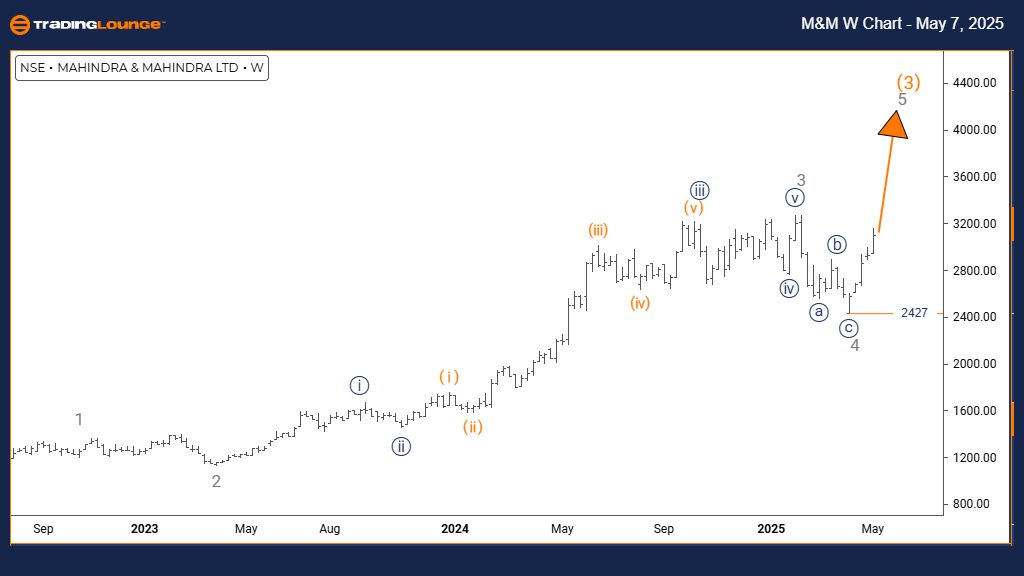
MAHINDRA & MAHINDRA - Elliott Wave Analysis - Trading Lounge Weekly Chart
MAHINDRA & MAHINDRA Elliott Wave Technical Analysis
FUNCTION: Trend
MODE: Impulsive
STRUCTURE: Gray Wave 5
POSITION: Orange Wave 3
DIRECTION NEXT HIGHER DEGREES: Gray Wave 5 (active)
DETAILS: Gray Wave 4 looks complete; Gray Wave 5 is now active.
Wave Cancel/Invalid Level: 2427
The Mahindra & Mahindra weekly chart confirms a bullish trend advancing towards its terminal phase, following an impulsive Elliott Wave pattern. The stock has completed the Gray Wave 4 correction and has entered Gray Wave 5, situated within the broader Orange Wave 3 structure. This alignment highlights the last upward phase in the current bullish sequence before a broader correction becomes likely.
Gray Wave 5 typically represents the final stage of a bullish move. It may either demonstrate strong acceleration or signs of weakness as it concludes. Completing Gray Wave 4 paved the way for this advance, often resulting in new swing highs before eventual exhaustion.
The weekly chart gives critical insights into the bullish wave's progression, showing the stock likely entering the later stages of its rally. Transitioning into Orange Wave 3 at a higher degree implies that a larger bullish cycle could still unfold. The important level to watch remains 2427; a fall below this threshold would invalidate the current wave structure.
Traders should focus on identifying signs of Wave 5 termination, such as bearish divergence or reversal candlestick formations. It is essential to prepare for a potential trend reversal even though wave extensions could push the bullish move further.
Tracking technical indicators and price action is essential to pinpoint when the trend might lose momentum. The completion of Gray Wave 5 could initiate a larger corrective move. Traders should monitor closely for exit opportunities as the structure nears its conclusion.
Technical Analyst: Malik Awais
Source: Visit Tradinglounge.com and learn from the Experts. Join TradingLounge Here
Previous: EICHER MOTORS Elliott Wave Technical Analysis
VALUE Offer - Buy 1 Month & Get 3 Months!Click here
Access 7 Analysts Over 200 Markets Covered. Chat Room With Support