24Jun

Elliott Wave Forecast Reveals Bearish Short-Term Trend for ASX:NST NORTHERN STAR RESOURCES LTD With Price Target

ASX: NORTHERN STAR RESOURCES LTD – NST Elliott Wave Technical Analysis

Hello traders,

This Elliott Wave market update covers the recent price action for Northern Star Resources Ltd (ASX:NST), listed on the Australian Securities Exchange. Based on our latest technical analysis, ASX:NST appears to be entering a short-term bearish wave, potentially moving towards the target zone near 16.86 AUD. At this point, our indicators suggest that a bullish reversal is not anticipated.

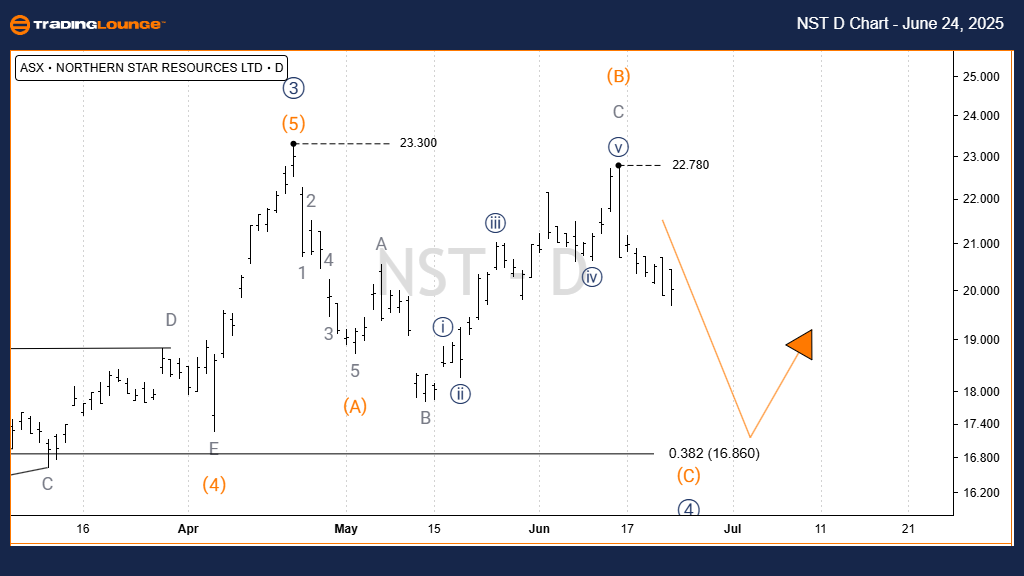
ASX: NORTHERN STAR RESOURCES LTD – NST 1D Chart (Semilog Scale)

Trend Function: Major Trend (Minor Degree - Grey)

Market Mode: Motive

Wave Structure: Impulse

Wave Position: Wave C) - Orange of Wave 4)) - Navy

Technical Outlook
The current price structure reflects a downward development within Wave 4)) - Navy, which is unfolding as an ABC Zigzag correction in Orange.
Wave A)B) - Orange is likely completed. Since reaching a peak at 22.78 AUD, Wave C) - Orange seems to be progressing downward.
The anticipated downside target is around 16.86 AUD, with no bullish setup evident at this stage.

Invalidation Level: 23.78 AUD

NST-asx-day-chart-24...


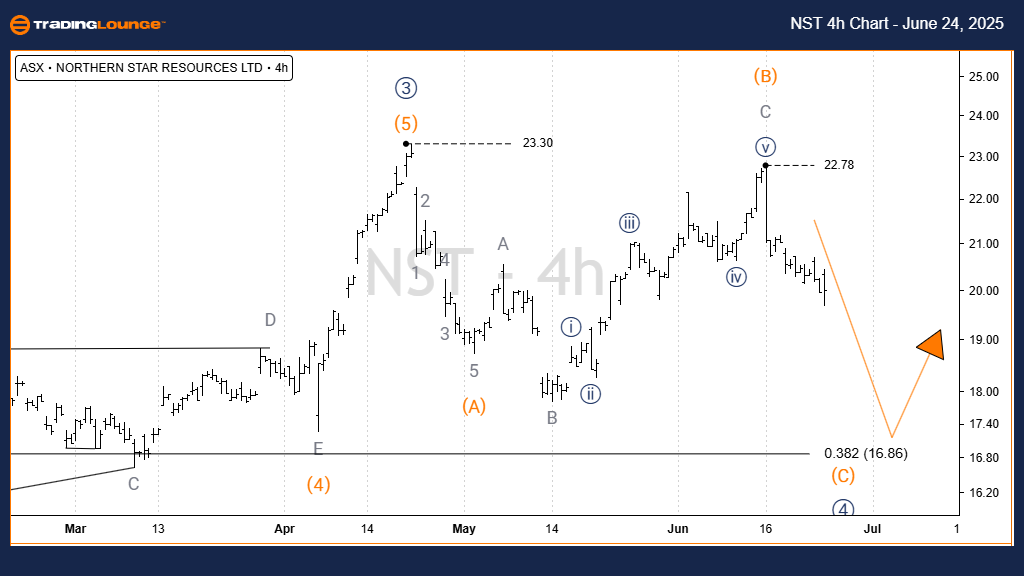
ASX: NORTHERN STAR RESOURCES LTD – NST Elliott Wave Analysis (4-Hour Chart)

4-Hour Chart Technical Overview

Trend Function: Major Trend (Minor Degree - Grey)

Market Mode: Motive

Wave Structure: Impulse

Wave Position: Wave C) - Orange of Wave 4)) - Navy

Key Observations
Within the 4-hour timeframe, price action aligns with our broader daily view.
Following the local high of 22.78 AUD, Wave C) - Orange continues to decline with a near-term objective of 16.86 AUD. No signs of bullish divergence are present.

Invalidation Level: 22.78 AUD

Technical Analyst: Hua (Shane) Cuong, CEWA-M (Master’s Designation).

Source: Visit Tradinglounge.com and learn from the Experts. Join TradingLounge Here 

See Previous: BHP GROUP LIMITED – BHP Elliott Wave Technical Analysis

VALUE Offer - $1 for 2 Weeks then $29 a month!Click here

Access 7 Analysts Over 200 Markets Covered. Chat Room With Support

NST-asx-4h-chart-240...

Conclusion

This Elliott Wave analysis provides a short-term technical forecast for ASX:NST (Northern Star Resources Ltd).
We have outlined significant price levels acting as validation and invalidation points, enhancing the reliability of our wave interpretation.
Our aim is to deliver a clear, professional overview of current market momentum, assisting traders in forming data-backed strategies.

Related

Coca-Cola Company (KO) Elliott Wave Technical Analysis: KO stock trends with Daily & 4Hr Charts

Coca-Cola Company (KO) Elliott Wave Technical Analysis: KO stock trends with Daily & 4Hr Charts

In the realm of Elliott Wave Analysis, The Coca-Cola Company (KO) is under scrutiny, with a focus on...

Read More >
Elliott Wave Analysis: Key Signals to Watch in S&P 500 and NASDAQ 100 This Week

Elliott Wave Analysis: Key Signals to Watch in S&P 500 and NASDAQ 100 This Week

The Elliott Wave analysis for the S&P 500 and NASDAQ 100 suggests that these indices have not yet re...

Read More >
ASX: Newmont Corporation (NEM) Elliott Wave Analysis with Bullish Targets, Invalidation Level & Technical Chart Forecast for Traders

ASX: Newmont Corporation (NEM) Elliott Wave Analysis with Bullish Targets, Invalidation Level & Technical Chart Forecast for Traders

This technical analysis offers a clear Elliott Wave forecast for ASX: NEM, detailing price targets, ...

Read More >
Powerful S&P/ASX 200 Index Elliott Wave Technical Analysis: Uncover Strong Bullish Market Trends and Forecasts

Powerful S&P/ASX 200 Index Elliott Wave Technical Analysis: Uncover Strong Bullish Market Trends and Forecasts

The S&P/ASX 200 continues in a strong bullish trend with both orange wave 3 and navy blue wave 3 act...

Read More >
Wheat Commodity Price Forecast: Elliott Wave Setup, Key Support Zones, Bearish Exhaustion, and High-Probability Trade Opportunities

Wheat Commodity Price Forecast: Elliott Wave Setup, Key Support Zones, Bearish Exhaustion, and High-Probability Trade Opportunities

Elliott Wave analysis of the wheat market, examining the ongoing bearish trend and forecasting futur...

Read More >

$1 for 2 Weeks

then $29 a month!

What a Special Offer!

Trade Recommendations

Unleash the power of deversified trading with our comprehensive portfolio, covering 250+ markets:

  • Stock Trades
  • Crypto Trades
  • Forex Trades
  • Commodity Trades
Elliott Wave Analysis

Gain a competitive edge with expert insights and AI-powered Elliott Wave charting into:

  • Global Indices
  • US Stocks & ASX Stocks
  • Forex & Crypto
  • Commodities
Top-Notch Trading Tools

Equip yourself with the tools of success:

  • Real-time Chat rooms
  • Elliott Wave Algorithm
  • Portfolio tools
  • TradingLevels
  • Screener
  • Trading Game
7 Elliott Wave Analysts

Stay ahead of the market with daily charts and insightful videos
Your secret to strategic trading!

JOIN HERE


Welcome to TradingLounge (ASIC A.R.No. 321187), specialists in trades, trading education and technical analysis, covering stocks, indices, commodities, forex and cryptocurrencies.

When you join TradingLounge you have access to everything we offer, including trade tools, educational content and a social platform to chat with like-minded investors.

Read more

@Copyright 2024 by tradinglounge.com

Contact Us

Australian no: 02 4787 6020

International no: +61 (2) 47876020

Pay with:

Find us on