14Feb

Coca-Cola Company (KO) Elliott Wave Technical Analysis: KO stock trends with Daily & 4Hr Charts

KO Elliott Wave Analysis Trading Lounge Daily Chart

Welcome to our KO Elliott Wave Analysis Trading Lounge, your go-to destination for comprehensive insights into The Coca-Cola Company (KO) using Elliott Wave Technical Analysis. As of the Daily Chart, we delve into significant trends shaping the market.  

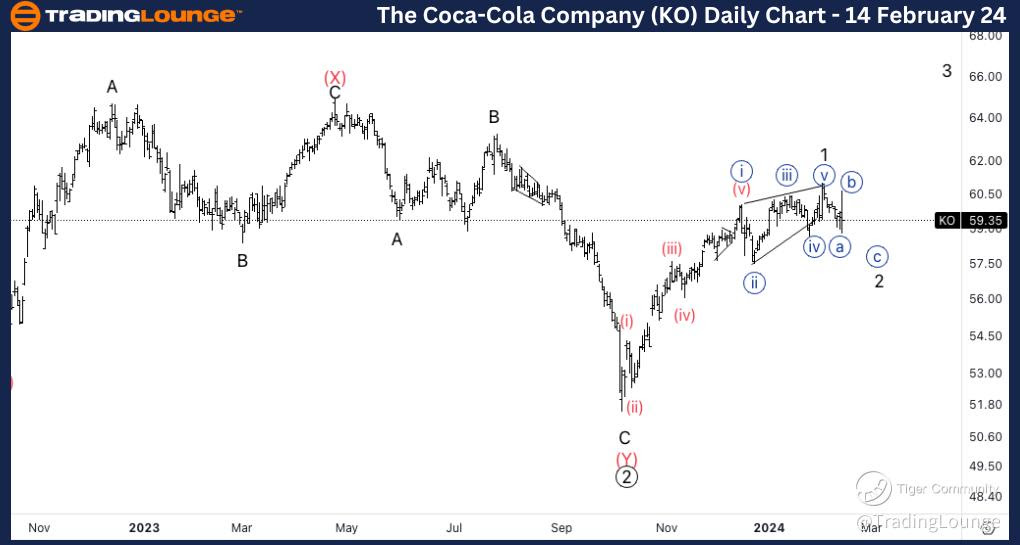
The Coca-Cola Company, (KO) Daily Chart Analysis:

KO Elliott Wave Technical Analysis

Function: Trend

Mode: Impulse

Structure: Motive

Position: Minor wave 2 of (1)

Direction: Anticipating completion of wave 2 before upward continuation

In this analysis, a leading diagonal within wave 1 is considered, leading to the expectation of the completion of Minor wave 2. The current wave appears to be in {b} of 2, with a potential upward trajectory towards All-Time Highs (ATH) anticipated thereafter.

The-Coca-Cola-Day-St...


KO Elliott Wave Analysis Trading Lounge 4Hr Chart, 14 February 24 

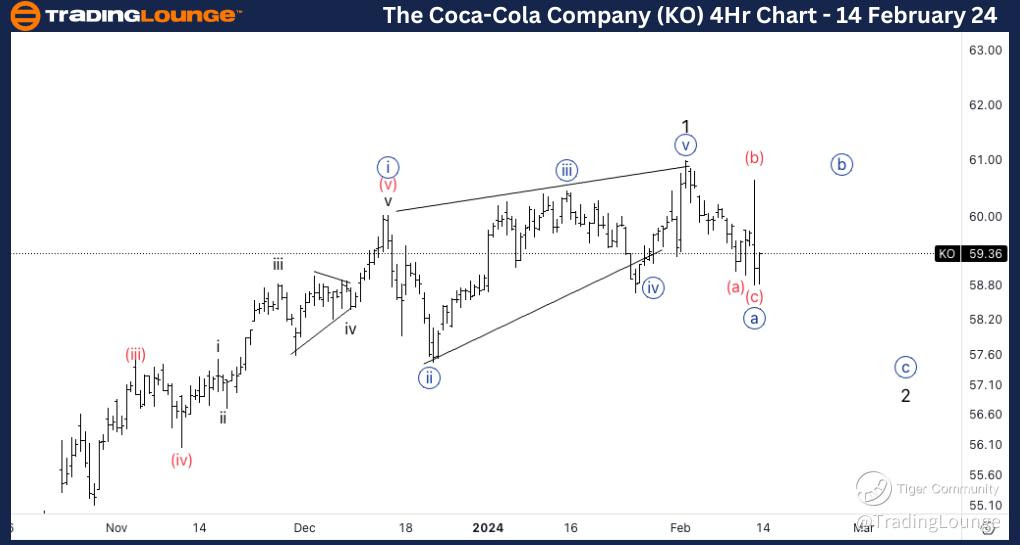
The Coca-Cola Company, (KO) 4Hr Chart Analysis:

Function: Countertrend

Mode: Corrective

Structure: Flat

Position: Wave {b} of 2

Direction: Upside movement within wave {b} of 2

This segment of the analysis indicates a corrective phase, specifically a Flat structure within wave {b} of 2. The focus is on finding support around $59 and subsequently experiencing a pullback in wave {b}. Resistance might be encountered around $60 before a potential decline into wave {c}, leading towards wave {ii} of the diagonal.

In summary, the Elliott Wave analysis of The Coca-Cola Company (KO) on both the daily and 4-hour charts reveals potential trends and corrective movements, guiding traders in their decision-making processes.

Technical Analyst: Alessio Barretta 

Source: visit Tradinglounge.com and learn From the Experts Join TradingLounge Here 

See Previous: Pepsico Inc. (PEP)

The-Coca-Cola-4Hr-St...

* KO Elliott Wave Technical Analysis – Daily Chart* 

In terms of wave dynamics, we identify a prevailing impulse function with a motive structure. The current position is in Minor wave 2 of (1), indicating a completion of wave 2 before further upward movement. We explore an alternative count where a leading diagonal is present in wave 1. Our focus is on the completion of Minor wave 2, with the current wave appearing to be wave {b} of 2, followed by an anticipated continuation higher towards All-Time Highs (ATH). 

* KO Elliott Wave Technical Analysis – 4Hr Chart* 

Here, the wave function shifts to a counter trend approach with a corrective mode, reflecting a flat structure. The present position is in Wave {b} of 2, indicating an upside movement into wave {b} of 2. We anticipated finding support above $59, followed by a pullback in wave {b}. Potential resistance is expected around $60 before a subsequent fall back into wave {c}, ultimately heading towards wave {ii} of the diagonal. 

Related

ASX: GOODMAN GROUP (GMG) Elliott Wave Technical Analysis – Invalidation Points, and Actionable Stock Market Insights

ASX: GOODMAN GROUP (GMG) Elliott Wave Technical Analysis – Invalidation Points, and Actionable Stock Market Insights

Elliott Wave analysis for ASX: GOODMAN GROUP (GMG) reports examine wave (iv)-orange trends, key vali...

Read More >
Mastering ASX Trading: V300AEQ ETF UNITS – VAS Stock Analysis & Elliott Wave Forecast

Mastering ASX Trading: V300AEQ ETF UNITS – VAS Stock Analysis & Elliott Wave Forecast

This article provides an in-depth Elliott Wave analysis of ASX: VAS and V300AEQ ETF UNITS, highlight...

Read More >
Enhance Your Crypto Trading skills with Binance Crypto Price News Today Elliott Wave Technical Analysis

Enhance Your Crypto Trading skills with Binance Crypto Price News Today Elliott Wave Technical Analysis

In this guide, we delve into Elliott Wave analysis and its application in trading Binance Coin (BNBU...

Read More >
Wheat's price dynamics and trajectory projections: Commodities Wheat Elliott Wave Technical Analysis

Wheat's price dynamics and trajectory projections: Commodities Wheat Elliott Wave Technical Analysis

​​​​​​​Emphasizing Wheat's Elliott Wave Analysis aids in deciphering prevailing market tr...

Read More >
NIFTY 50 Elliott Wave Technical Analysis: Expanded Flat Correction Nears 25,000-25,100, Key Support at 22,700

NIFTY 50 Elliott Wave Technical Analysis: Expanded Flat Correction Nears 25,000-25,100, Key Support at 22,700

The NIFTY 50 Index is currently in a corrective wave phase, moving towards 25,000-25,100 as part of ...

Read More >

Buy 1 Month

Get 3 Months!

Special Offer:

Trade Recommendations

Unleash the power of deversified trading with our comprehensive portfolio, covering:

  • Stock Trades
  • Crypto Trades
  • Forex Trades
  • Commodity Trades
Elliott Wave Analysis

Gain a competive edge with expert insights in to:

  • Global Indices
  • US Stocks & ASX Stocks
  • Forex & Crypto
  • Commodities
Top-Notch Trading Tools

Equip yourself with the tools of success:

  • Social Chat
  • Elliott Wave Algorithm
  • Screener
  • TradingLevels
  • Trading Game
7 Elliott Wave Analysts

Stay ahead of the market with daily charts and insightful videos
-Your secret to strategic trading!

JOIN HERE


Welcome to TradingLounge (ASIC A.R.No. 321187), specialists in trades, trading education and technical analysis, covering stocks, indices, commodities, forex and cryptocurrencies.

When you join TradingLounge you have access to everything we offer, including trade tools, educational content and a social platform to chat with like-minded investors.

Read more

@Copyright 2024 by tradinglounge.com

Contact Us

Australian no: 02 4787 6020

International no: +61 (2) 47876020

Pay with:

Find us on