Cardano / U.S. Dollar (ADAUSD) Elliott Wave Analysis - TradingLounge Daily Chart
ADAUSD Elliott Wave Technical Analysis – Bullish Reversal in Sight
Function: Counter-Trend
Mode: Corrective
Structure: Flat
Position: Wave ((C))
Next Higher Degree Direction: Wave II
Invalidation Level: N/A
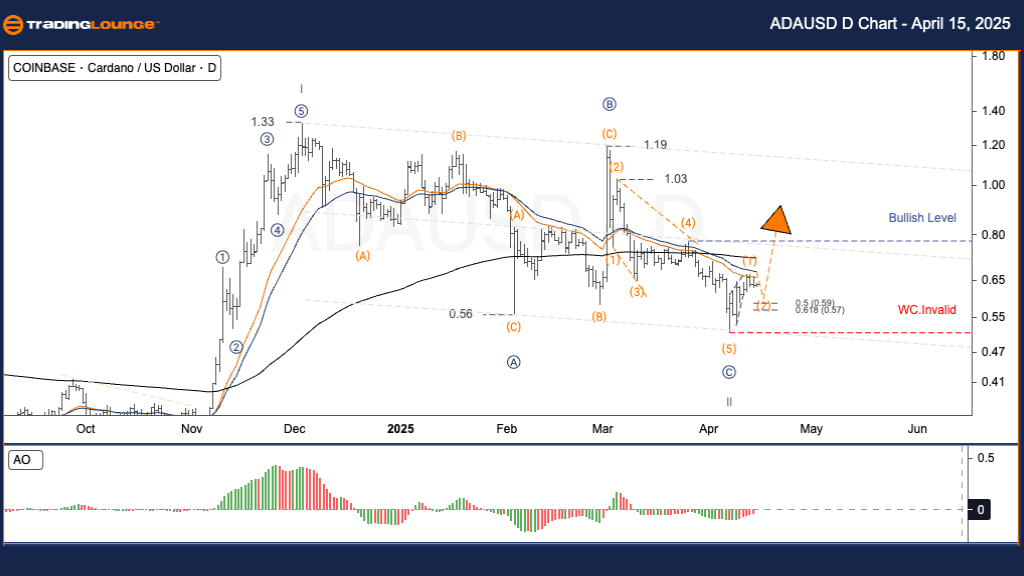
Cardano (ADAUSD) Trading Strategy – Daily Chart Outlook:
Cardano has been undergoing a large ABC corrective structure within Wave II since late 2024. Current Elliott Wave analysis identifies a potential trend reversal as ADA forms a solid base near the $0.514 mark, marking the end of Wave ((C)). This “Bottom Confirmed” pattern signals the beginning of Wave III, a bullish impulse wave.
- Wave I: Completed at $1.33
- Wave II: Extended over 4 months forming a Flat correction
- Wave C: Terminated at $0.514
Trading Strategies
Strategy Overview – Swing Trading Opportunity:
✅ Swing traders should monitor the $0.59–$0.57 range for long entries. A breakout above $0.769 resistance confirms bullish momentum.
Risk Management:
Invalidation Level: A decline below $0.514 invalidates the bullish count and calls for re-evaluation.
Cardano / U.S. Dollar (ADAUSD) Elliott Wave Analysis - TradingLounge H4 Chart
ADAUSD Elliott Wave Technical Analysis – Short-Term Reversal Setup
Function: Counter-Trend
Mode: Corrective
Structure: Flat
Position: Wave ((C))
Next Higher Degree Direction: Wave II
Invalidation Level: N/A
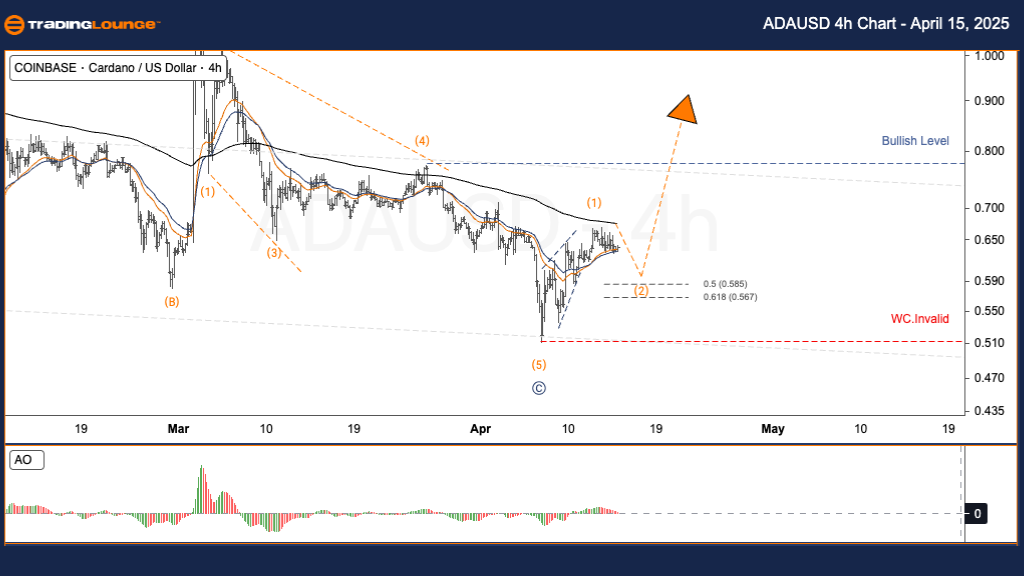
Cardano (ADAUSD) Trading Strategy – H4 Chart Insight:
On the 4-hour timeframe, Cardano maintains its corrective structure, but the completion of Wave ((C)) at $0.514 supports a bullish reversal. ADA now enters a setup phase for a potential rally under Wave III as momentum shifts.
- Wave I: Peaked at $1.33
- Wave II: Developed over 4 months in a classic Flat correction
- Wave C: Completed at $0.514
Trading Strategies
Strategy Overview – Swing Trade Setups:
✅ Price zone between $0.59–$0.57 presents entry potential for swing traders. A confirmed break above $0.769 adds strength to the upward move.
Risk Management:
Invalidation Level: A move below $0.514 negates the current bullish count and signals structural change.
Technical Analyst: Kittiampon Somboonsod, CEWA
Source: Visit Tradinglounge.com and learn from the Experts Join TradingLounge Here
Previous: NEOUSD Elliott Wave Technical Analysis
VALUE Offer - Buy 1 Month & Get 3 Months!Click here
Access 7 Analysts Over 200 Markets Covered. Chat Room With Support