01Apr

Cardano (ADAUSD) Elliott Wave Analysis: Fibonacci Support, and Bullish Trading Strategy for Swing Traders and Crypto Investors

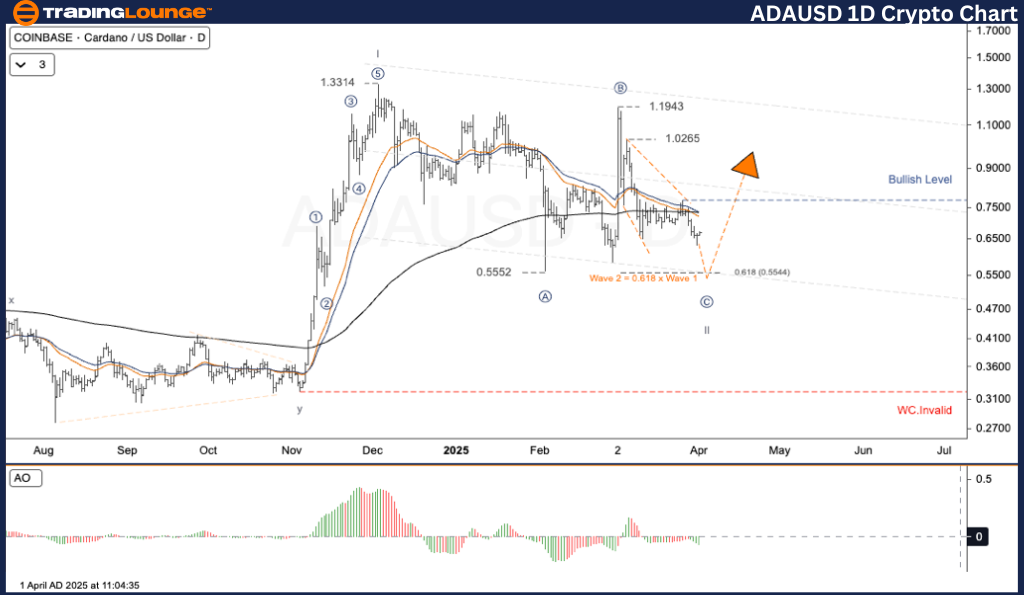
ADA/USD (Cardano vs U.S. Dollar) Elliott Wave Analysis – TradingLounge Daily Chart

ADA/USD Elliott Wave Technical Overview

Function: Counter-Trend

Mode: Corrective

Structure: Flat

Current Position: Wave ((C))

Next Direction (Higher Degree): Wave II

Invalidation Level: Not specified

ADA/USD Trading Strategy – Daily View

Cardano (ADA/USD) is currently undergoing a corrective phase within the Elliott Wave framework, classified under Wave II. This movement reflects a retracement and is now testing a strong support zone near $0.5544, aligning with the 0.618 Fibonacci retracement of Wave I.

Trading Strategies

Strategy Overview:

✅ Short-Term Traders (Swing Trading)

📌 Bullish Scenario:

  • If ADA/USD sustains above the key $0.5544 support and starts showing a bullish reversal pattern, initiating a Buy position may be suitable.
  • The target for the upward wave movement is projected near $0.8500.
  • A confirmed breakout above the designated bullish level will validate upward momentum.

Risk Management:

  • A break below the crucial $0.2850 support will invalidate the current bullish Elliott Wave formation.

ADAUSD-1d-crypto-cha...


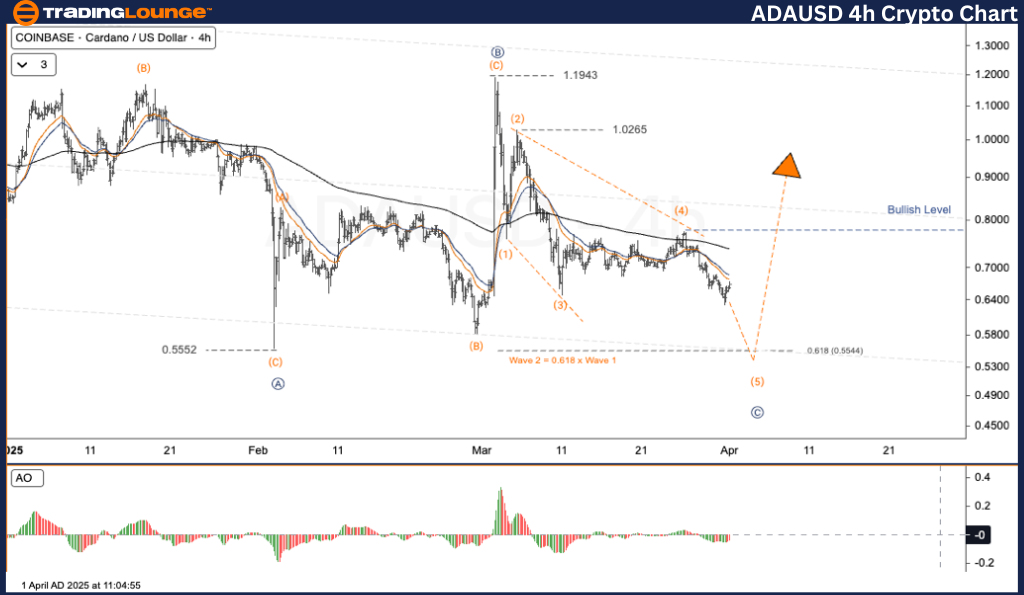
ADA/USD (Cardano vs U.S. Dollar) Elliott Wave Analysis – TradingLounge H4 Chart

ADA/USD Elliott Wave Technical Overview

Function: Counter-Trend

Mode: Corrective

Structure: Flat

Current Position: Wave ((C))

Next Direction (Higher Degree): Wave II

Invalidation Level: Not specified

ADA/USD Trading Strategy – H4 View

In the 4-hour timeframe, Cardano remains within the corrective Wave II phase of the Elliott Wave model. It is approaching a significant support region around $0.5544, consistent with the 0.618 Fibonacci retracement level from Wave I.

Trading Strategies

Strategy Overview:

✅ Short-Term Traders (Swing Trading)

📌 Bullish Scenario:

  • If ADA/USD stays above $0.5544 and initiates a bullish reversal, it presents a favorable opportunity for a Buy setup.
  • The target remains at $0.8500.
  • A breakout above the bullish threshold confirms a strong bullish outlook.

Risk Management:

  • A drop below $0.2850 negates the bullish wave structure and suggests a shift in trend.

Technical Analyst: Kittiampon Somboonsod

Source: Visit Tradinglounge.com and learn from the Experts. Join TradingLounge Here 

Previous: BNBUSD Elliott Wave Technical Analysis

VALUE Offer - Buy 1 Month & Get 3 Months!Click here

Access 7 Analysts Over 200 Markets Covered. Chat Room With Support

ADAUSD-4h-crypto-cha...

Related

Bovespa Index Elliott Wave Forecast: Brazil Stocks Bullish Trend with Daily and Weekly Technical Analysis and Trading Strategy

Bovespa Index Elliott Wave Forecast: Brazil Stocks Bullish Trend with Daily and Weekly Technical Analysis and Trading Strategy

Bullish Elliott Wave forecast for Bovespa Index. See daily and weekly charts, trend outlook, wave st...

Read More >
Uniswap Crypto Forecast: Elliott Wave Signals Bullish Reversal – UNIUSD Trading Strategy, Price Targets & Key Breakout Levels

Uniswap Crypto Forecast: Elliott Wave Signals Bullish Reversal – UNIUSD Trading Strategy, Price Targets & Key Breakout Levels

Uniswap (UNIUSD) shows signs of a completed Elliott Wave correction, hinting at a bullish reversal n...

Read More >
Explosive AAVE Price Forecast: AAVEUSD Elliott Wave Analysis, Bullish Breakout Strategy & Key Trade Levels for Smart Crypto Traders

Explosive AAVE Price Forecast: AAVEUSD Elliott Wave Analysis, Bullish Breakout Strategy & Key Trade Levels for Smart Crypto Traders

AAVE may be completing a major five-wave decline with a potential trend reversal forming. Our Elliot...

Read More >
Effective trading strategies and technical analysis: British Pound/U.S.Dollar(GBPUSD) Forex Elliott Wave Technical Analysis

Effective trading strategies and technical analysis: British Pound/U.S.Dollar(GBPUSD) Forex Elliott Wave Technical Analysis

This detailed analysis of GBP/USD using Elliott Wave Theory provides key insights into the current m...

Read More >
S&P/TSX 60 Elliott Wave Analysis: Daily and Weekly TSX Index Forecast with Wave 2 Correction and Wave 3 Breakout Insight

S&P/TSX 60 Elliott Wave Analysis: Daily and Weekly TSX Index Forecast with Wave 2 Correction and Wave 3 Breakout Insight

Elliott Wave analysis of the S&P/TSX 60 index on both daily and weekly timeframes. It highlights the...

Read More >
DOW JONES (DJI) Index Elliott Wave Analysis Provides a Detailed Technical Outlook on the DJI Stock Market Trend

DOW JONES (DJI) Index Elliott Wave Analysis Provides a Detailed Technical Outlook on the DJI Stock Market Trend

Dow Jones, Elliott Wave, stock forecast, market trends, DJI analysis, trading strategy, technical an...

Read More >

$1 for 2 Weeks

then $29 a month!

What a Special Offer!

Trade Recommendations

Unleash the power of deversified trading with our comprehensive portfolio, covering 250+ markets:

  • Stock Trades
  • Crypto Trades
  • Forex Trades
  • Commodity Trades
Elliott Wave Analysis

Gain a competitive edge with expert insights and AI-powered Elliott Wave charting into:

  • Global Indices
  • US Stocks & ASX Stocks
  • Forex & Crypto
  • Commodities
Top-Notch Trading Tools

Equip yourself with the tools of success:

  • Real-time Chat rooms
  • Elliott Wave Algorithm
  • Portfolio tools
  • TradingLevels
  • Screener
  • Trading Game
7 Elliott Wave Analysts

Stay ahead of the market with daily charts and insightful videos
Your secret to strategic trading!

JOIN HERE


Welcome to TradingLounge (ASIC A.R.No. 321187), specialists in trades, trading education and technical analysis, covering stocks, indices, commodities, forex and cryptocurrencies.

When you join TradingLounge you have access to everything we offer, including trade tools, educational content and a social platform to chat with like-minded investors.

Read more

@Copyright 2024 by tradinglounge.com

Contact Us

Australian no: 02 4787 6020

International no: +61 (2) 47876020

Pay with:

Find us on