USDCAD Elliott Wave Analysis Trading Lounge Day Chart
U.S. Dollar / Canadian Dollar Day Chart Analysis
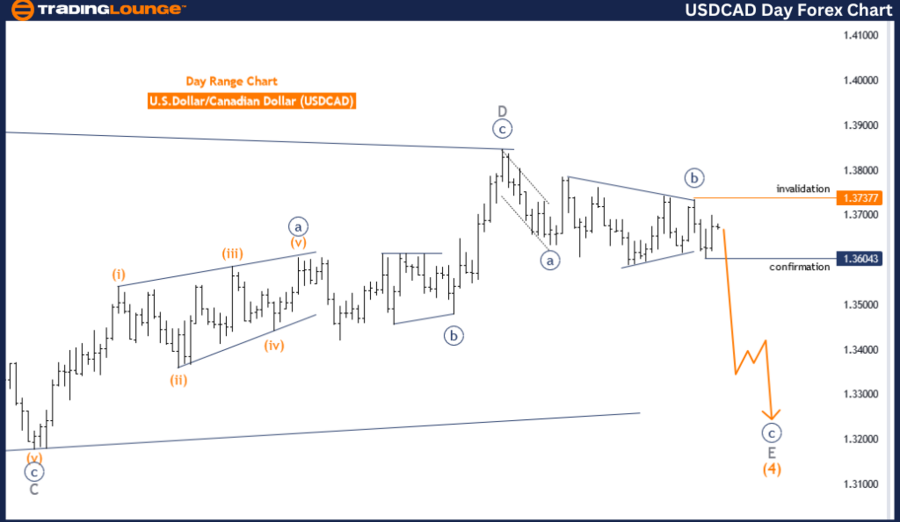
USD/CAD Elliott Wave Technical Analysis
Function: Counter Trend
Mode: Corrective
Structure: Navy Blue Wave C
Position: Gray Wave E
Direction Next Lower Degrees: Navy Blue Wave C (continue)
Details: Navy Blue Wave B of E looks completed, now Navy Blue Wave C is in play.
Wave Cancel Invalid Level: 1.37377
The USD/CAD Elliott Wave Analysis for the daily chart offers a detailed look at the current market movements using Elliott Wave Theory. The analysis identifies the market's function as counter-trend, indicating that the current price movements are against the larger prevailing trend.
The wave mode is described as corrective, typically characterized by a series of overlapping waves that move against the main trend. Corrective waves are less predictable and involve a more complex structure than impulsive waves.
The specific structure under analysis is Navy Blue Wave C. The current position is Gray Wave E, suggesting the market is in the latter stages of a corrective pattern, which often precedes the resumption of the main trend.
The analysis indicates that Navy Blue Wave B of E appears completed. This means the market has likely finished a phase of consolidation or correction and is now entering the next phase of the corrective pattern. The current phase, Navy Blue Wave C, is now in play, involving a continuation of the corrective pattern, potentially leading to significant market movements.
The direction of the next lower degrees continues within the framework of Navy Blue Wave C, reinforcing the expectation of ongoing corrective movements. The wave cancel invalid level is set at 1.37377. If the market price drops below this level, the current wave count would be invalidated, necessitating a reassessment of the wave structure.
In summary, the USD/CAD Elliott Wave Analysis for the daily chart highlights a counter-trend movement within a corrective mode. The completion of Navy Blue Wave B of E and the initiation of Navy Blue Wave C suggest the market is continuing its corrective pattern. This phase is crucial as it involves ongoing, potentially significant market movements against the main trend. This analysis provides valuable insights for traders into the current market dynamics and potential future price actions.

USDCAD Elliott Wave Analysis Trading Lounge 4-Hour Chart
U.S. Dollar / Canadian Dollar 4-Hour Chart Analysis
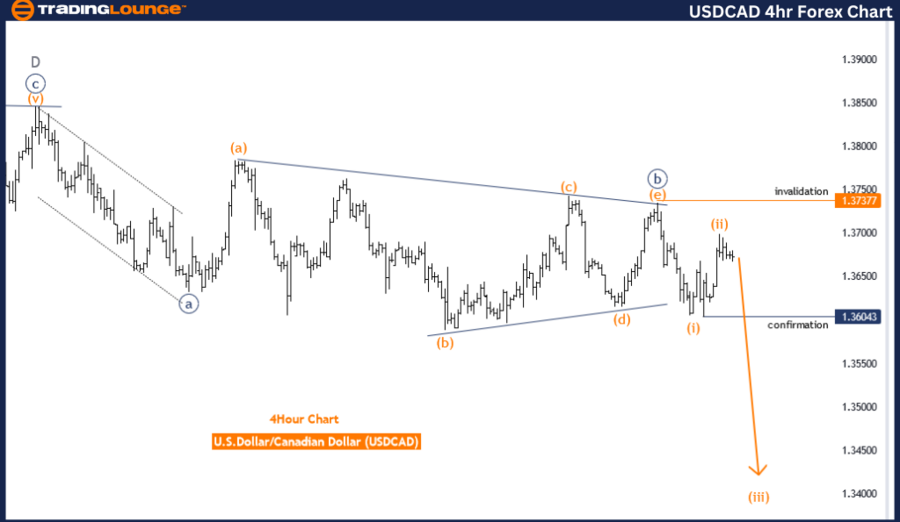
USD/CAD Elliott Wave Technical Analysis
Function: Counter Trend
Mode: Impulsive
Structure: Orange Wave 3
Position: Navy Blue Wave C
Direction Next Lower Degrees: Orange Wave 3 (started)
Details: Orange Wave 2 of C looks completed, now Orange Wave 3 is in play.
Wave Cancel Invalid Level: 1.37377
The USD/CAD Elliott Wave Analysis for the 4-hour chart provides insights into the current market movement using Elliott Wave Theory. This analysis identifies the market's function as a counter-trend, suggesting that the current price movements are going against the prevailing larger trend.
The mode of the wave structure is described as impulsive. In Elliott Wave Theory, an impulsive wave is characterized by strong, directional movements that are typically part of a five-wave pattern. These waves move in the direction of the overall trend and indicate decisive action in the market.
The specific structure being analyzed is Orange Wave 3, part of a larger Navy Blue Wave C. This positioning signifies that the market is in a phase where strong movements are expected as part of the impulsive wave pattern. The analysis indicates that Orange Wave 2 of C has likely been completed. This means the market has finished a corrective phase and is now moving into the next phase of strong, directional movement.
Currently, the market is in Orange Wave 3 of Navy Blue Wave C. This phase is important because it typically involves significant price movements and is a key part of the impulsive wave structure. The direction of the next lower degrees continues within the framework of Orange Wave 3, reinforcing the expectation of ongoing strong market movements.
The details emphasize that Orange Wave 2 of C appears completed, and the market is now in Orange Wave 3. This wave is critical as it suggests the market will continue with strong, directional price movements. The wave cancel invalid level is set at 1.37377, meaning that if the market price drops below this level, the current wave count would be invalidated, requiring a reassessment of the wave structure.
In summary, the USD/CAD Elliott Wave Analysis for the 4-hour chart highlights a counter-trend movement within an impulsive mode. The completion of Orange Wave 2 of C and the initiation of Orange Wave 3 indicate strong, directional price movements against the larger trend. This analysis provides traders with valuable insights into the ongoing market dynamics and potential future movements.
Technical Analyst: Malik Awais
Source: visit Tradinglounge.com and learn From the Experts Join TradingLounge Here
Previous: EURGBP Elliott Wave Technical Analysis
Special Trial Offer - 0.76 Cents a Day for 3 Months! Click here
Access 7 Analysts Over 170 Markets Covered. Chat Room With Support
