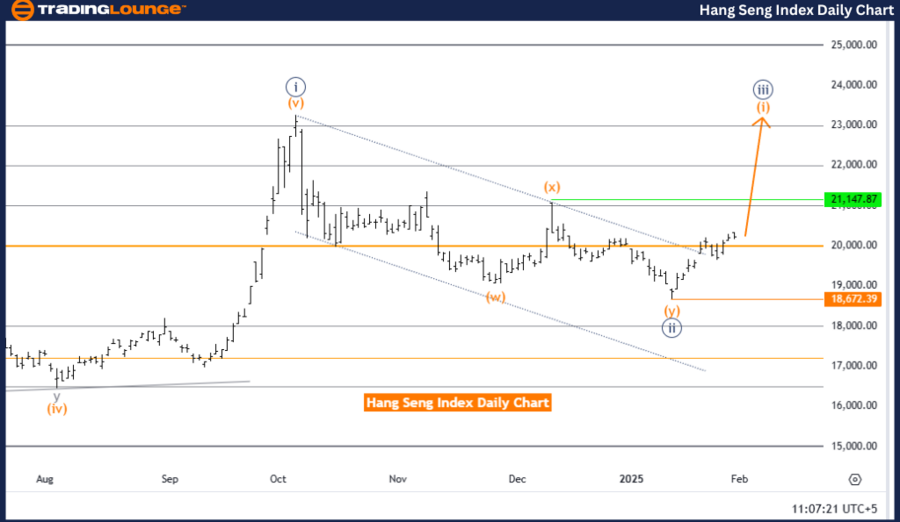
Hang Seng Index Elliott Wave Analysis – Trading Lounge Day Chart
Hang Seng Index Elliott Wave Technical Analysis
Technical Analysis Overview
Function: Bullish Trend
Mode: Impulsive
Structure: Orange Wave 1
Position: Navy Blue Wave 3
Next Higher Degree Direction: Orange Wave 1 (initiated)
Details: Navy Blue Wave 2 appears to have concluded, with Orange Wave 1 of 3 now underway.
Wave Cancel Invalidation Level: 18,672.39
Analysis Overview
This daily chart analysis evaluates the Hang Seng Index using Elliott Wave Theory, emphasizing a bullish trend operating in an impulsive mode. The primary wave structure being tracked is Orange Wave 1, which has initiated after the apparent completion of Navy Blue Wave 2, signifying the continuation of a robust upward trajectory.
Currently, the index is progressing within Navy Blue Wave 3, reflecting sustained bullish momentum. The completion of Navy Blue Wave 2 indicates the end of a corrective phase, paving the way for the development of Orange Wave 1 of 3. This wave is projected to drive further upward movement in the market.
The invalidation level for this wave count is 18,672.39. Any drop below this level would invalidate the current wave structure and necessitate a reassessment of the market outlook and wave analysis.
Summary
The daily chart analysis of the Hang Seng Index outlines a bullish trend led by the development of Orange Wave 1 within Navy Blue Wave 3. The conclusion of Navy Blue Wave 2 and the ongoing Orange Wave 1 of 3 indicate renewed upward momentum.
This expected continuation of impulsive movement at higher degrees aligns with a bullish market outlook. The invalidation level acts as a key benchmark for managing risks and validating the wave count. This analysis equips traders with actionable insights into the ongoing bullish trend, enabling alignment of strategies with the market’s upward trajectory while closely monitoring critical levels for potential adjustments.
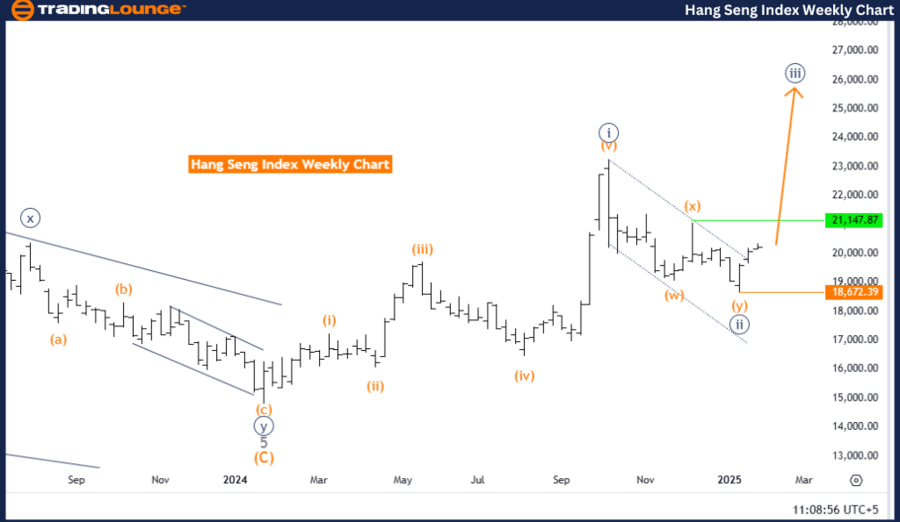
Hang Seng Index Elliott Wave Analysis – Trading Lounge Weekly Chart
Hang Seng Index Elliott Wave Technical Analysis
Technical Analysis Overview
Function: Bullish Trend
Mode: Impulsive
Structure: Navy Blue Wave 3
Position: Gray Wave 1
Next Higher Degree Direction: Navy Blue Wave 3 (initiated)
Details: Navy Blue Wave 2 appears to have concluded, and Navy Blue Wave 3 is now in progress.
Wave Cancel Invalidation Level: 18,672.39
Analysis Overview
This weekly chart analysis evaluates the Hang Seng Index using Elliott Wave Theory, highlighting a bullish trend operating in an impulsive mode. The primary wave structure being observed is Navy Blue Wave 3, which has commenced following the apparent completion of Navy Blue Wave 2, indicating a renewed upward market trend.
The index is currently positioned within Gray Wave 1, which is part of the broader Navy Blue Wave 3 structure. The conclusion of Navy Blue Wave 2 confirms the end of a corrective phase, setting the stage for the active development of Navy Blue Wave 3. This wave is anticipated to maintain bullish momentum, driving the market higher as part of the ongoing impulsive cycle.
The invalidation level for this wave count is 18,672.39. A decline below this threshold would invalidate the current wave structure and necessitate a reevaluation of the wave analysis and broader market outlook.
Summary
The weekly chart analysis for the Hang Seng Index highlights a strong bullish trend led by the progression of Navy Blue Wave 3. The completion of Navy Blue Wave 2 and the current positioning within Gray Wave 1 signal a transition into renewed upward momentum.
The expected continuation of impulsive movements at higher degrees aligns with a bullish market perspective. The invalidation level provides a critical benchmark for managing risks and validating the wave count. This structured analysis delivers key insights for traders, enabling alignment of strategies with the market’s upward trajectory while monitoring crucial levels for potential adjustments.
Technical Analyst: Malik Awais
Source: visit Tradinglounge.com and learn From the Experts Join TradingLounge Here
Previous: S&P 500 Elliott Wave Technical Analysis
VALUE Offer - Buy 1 Month & Get 3 Months!Click here
Access 7 Analysts Over 200 Markets Covered. Chat Room With Support