FTNT Elliott Wave Analysis: Trend Overview and Potential Movements
In this Elliott Wave analysis, we will examine the trend structure of Fortinet Inc. (FTNT) using both daily and 1-hour charts to evaluate the current wave position and predict potential price movements.
FTNT Elliott Wave Analysis: TradingLounge Daily Chart
Fortinet Inc. (FTNT) Daily Chart Analysis
FTNT Elliott Wave Technical Analysis
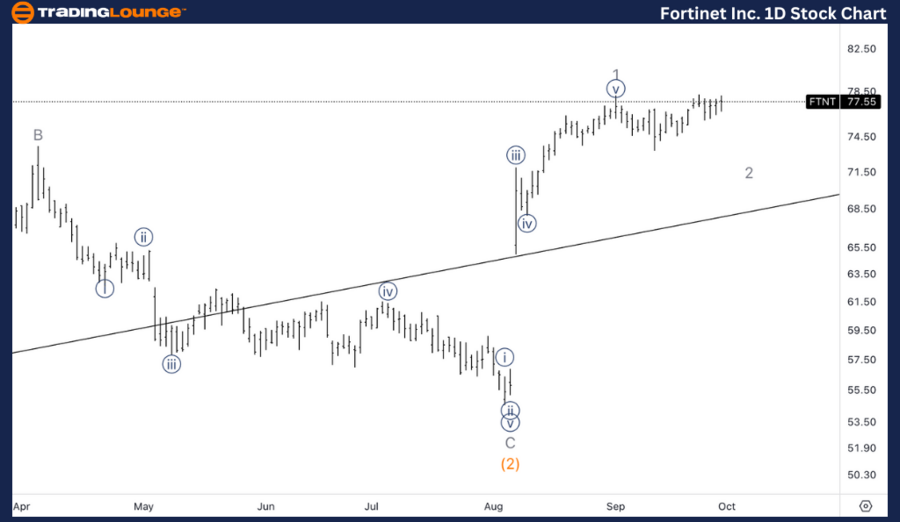
Function: Trend
Mode: Impulsive
Structure: Motive
Position: Wave 3
Direction: Upside in Wave 3
Details: A bottom appears to be in place for Minor Wave 2, as the stock progresses higher in Minor Wave 3 of (3). This development should lead to a steep ascent.
FTNT Stock Technical Analysis – Daily Chart Overview
On the daily chart, Fortinet Inc. is advancing through Wave 3 of an impulsive motive structure. After completing the corrective Minor Wave 2, the stock is now pushing higher within Minor Wave 3 of (3). This wave phase typically aligns with stronger price momentum and a steeper upward movement, signaling increased bullish sentiment.
The continuation of this uptrend in Wave 3 is expected to offer substantial upside potential. Traders should watch for confirmation of this momentum as the stock moves higher, likely showing strong bullish activity with minimal retracements during this impulsive phase.
FTNT Elliott Wave Analysis: 1-Hour Chart
Fortinet Inc. (FTNT) 1H Chart Analysis
FTNT Elliott Wave Technical Analysis
Function: Trend
Mode: Impulsive
Structure: Motive
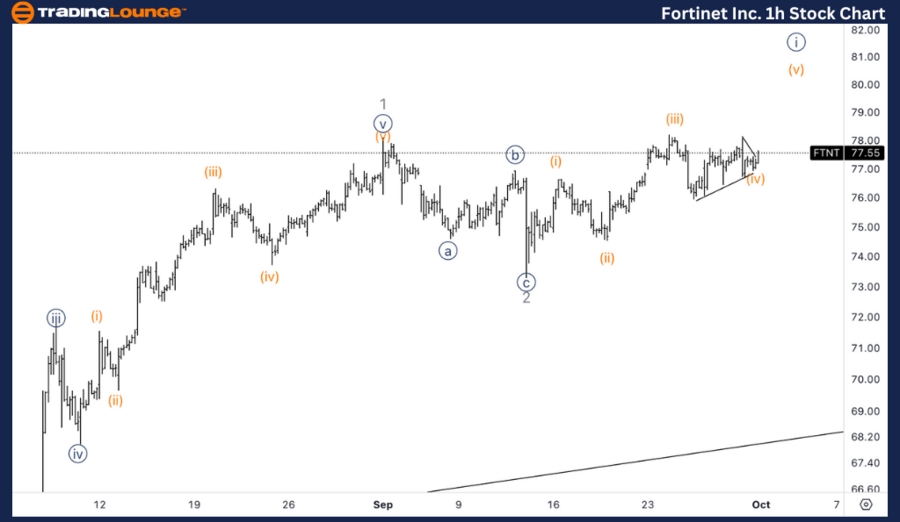
Position: Wave {i} of 3
Direction: Upside in Wave (v) of {i}
Details: Anticipating further upside within Wave (v) as the stock seems to be consolidating in a triangle formation in Wave (iv).
FTNT Technical Analysis – 1-Hour Chart Overview
On the 1-hour chart, Fortinet is progressing within Wave {i} of 3, and more specifically, within Wave (v) of {i}. The wave structure currently shows the stock forming a triangle in Wave (iv), suggesting a consolidation phase before a final upward push in Wave (v) to complete Wave {i}.
This triangle pattern typically signals an imminent breakout, and once Wave (v) concludes, traders can expect a minor corrective movement before the stock resumes its climb in Wave 3.
Technical Analyst: Alessio Barretta
Source: visit Tradinglounge.com and learn From the Experts Join TradingLounge Here
See Previous: Meta Platforms Inc. (META) Elliott Wave Technical Analysis
VALUE Offer - Buy 1 Month & Get 3 Months!Click here
Access 7 Analysts Over 200 Markets Covered. Chat Room With Support