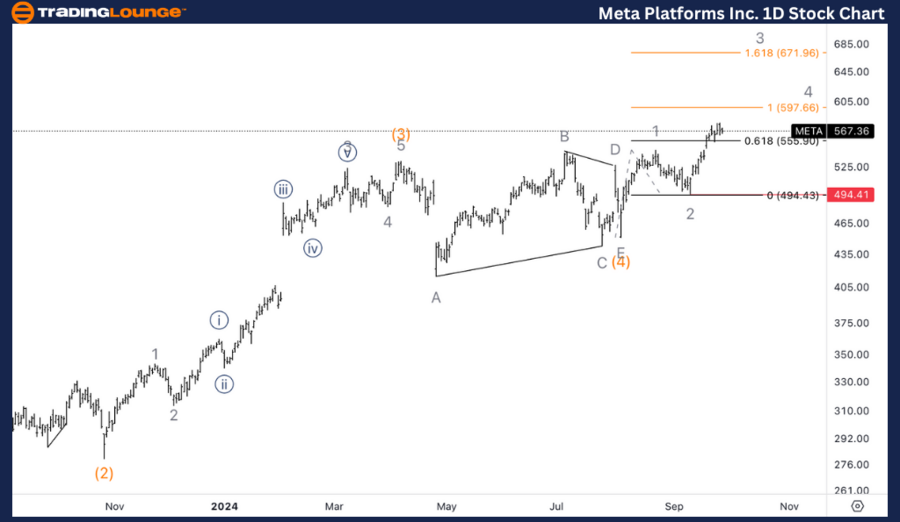
META Elliott Wave Analysis | Trading Lounge Daily Chart

Meta Platforms Inc. (META) Daily Chart Analysis

META Elliott Wave Technical Analysis

Function: Trend

Mode: Impulsive

Structure: Motive

Position: Intermediate wave (5)

Direction: Upside within wave (5)

Details: Meta Platforms is currently advancing from TradingLevel5 at $500, targeting the next upside level at MediumLevel $650.

META Stock Technical Analysis with Daily Chart

In the daily chart, Meta Platforms Inc. is within an impulsive wave structure, advancing in Intermediate Wave (5). After bouncing off the TradingLevel5 support at $500, the stock continues its upward trend, aiming for $650 as the next key resistance level at the Medium Level.

This upward movement within Wave (5) reinforces the current bullish trend. Meta is expected to see further gains as it approaches the $650 target. Traders should keep an eye on potential resistance at this level, as it may indicate the possibility of a corrective wave following this strong upward momentum.

Meta-Platforms-Inc-1...


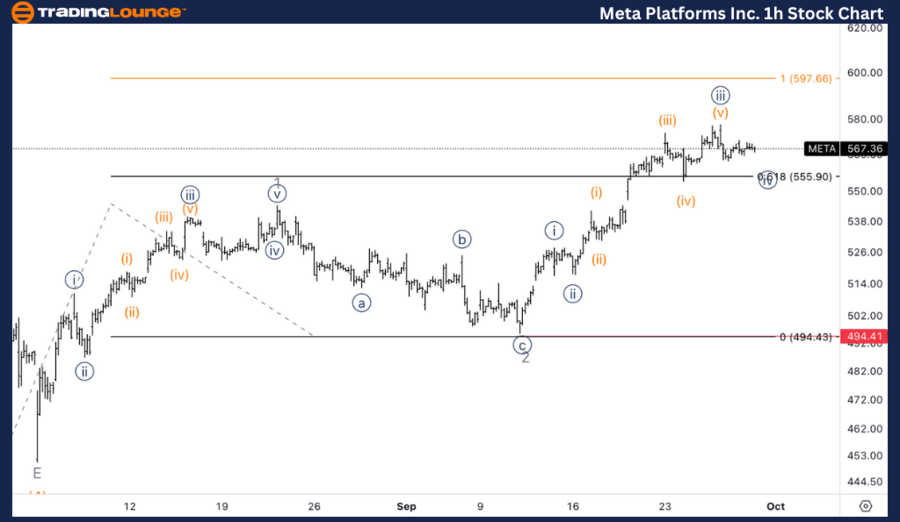
Meta Platforms Inc Elliott Wave Analysis | Trading Lounge 1H Chart

Meta Platforms Inc. (META) 1-Hour Chart Analysis

Meta Platforms Inc. Stock Analysis

Function: Trend

Mode: Impulsive

Structure: Motive

Position: Minor wave 3 of (5)

Direction: Upside within wave 3

Details: The price action suggests we are subdividing within wave 3, with continued upside expected in wave {v} of 3.

META Elliott Wave Technical Analysis – 1H Chart

On the 1-hour chart, Meta Platforms is progressing within Minor Wave 3 of (5). Current analysis shows the stock continuing to trend higher, with further subdivisions forming within Wave {v} of 3. This indicates that the stock is approaching the final stages of Wave 3, though there remains potential for further upside as Wave {v} completes.

As traders monitor this upward movement, they should watch for any signs of exhaustion in Wave 3, which could signal a pullback or correction before the next wave sequence begins. This could provide opportunities for short-term adjustments based on evolving market conditions.

Technical Analyst: Alessio Barretta

Source: visit Tradinglounge.com and learn From the Experts Join TradingLounge Here 

See Previous: McDonald’s Corp. (MCD) Elliott Wave Technical Analysis

VALUE Offer - Buy 1 Month & Get 3 Months!Click here

Access 7 Analysts Over 200 Markets Covered. Chat Room With Support

Meta-Platforms-Inc-1...

Related

TASI Index Elliott Wave Forecast Highlights Bullish Wave 3 Structure with Key Trading Levels for Saudi Stock Market Investors

TASI Index Elliott Wave Forecast Highlights Bullish Wave 3 Structure with Key Trading Levels for Saudi Stock Market Investors

TASI Index's impulsive bullish structure using Elliott Wave Theory, outlining key wave positions...

Read More >
Unlocking Profit Potential with Elliott Wave Analysis for Binance Coin (BNBUSD) Trading - 13th February 2024

Unlocking Profit Potential with Elliott Wave Analysis for Binance Coin (BNBUSD) Trading - 13th February 2024

The February 13, 2024, Binance Coin (BNBUSD) Elliott Wave Analysis, explores cryptocurrency market t...

Read More >
The Walt Disney Co. (DIS) Elliott Wave Analysis Reveals Bullish Daily Wave (3) Momentum and Short-Term Wave {v} Top

The Walt Disney Co. (DIS) Elliott Wave Analysis Reveals Bullish Daily Wave (3) Momentum and Short-Term Wave {v} Top

DIS Elliott Wave analysis examines Disney’s daily and 1‑hour charts. On the daily timeframe, DIS i...

Read More >
HDFC Bank Stock Analysis: Elliott Wave, Daily and 4H Chart Insights, Key Resistance Levels, and Future Predictions

HDFC Bank Stock Analysis: Elliott Wave, Daily and 4H Chart Insights, Key Resistance Levels, and Future Predictions

This article provides a comprehensive Elliott Wave analysis of HDFC Bank's stock, featuring insi...

Read More >
AUDUSD Elliott Wave Analysis: In-Depth Insights on 4-Hour and Day Charts - February 6, 2024

AUDUSD Elliott Wave Analysis: In-Depth Insights on 4-Hour and Day Charts - February 6, 2024

This detailed analysis delves into the AUDUSD currency pair's Elliott Wave patterns, examining b...

Read More >
GBPAUD Elliott Wave Forecast: British Pound Australian Dollar Corrective Structure and Trading Opportunities Using Technical Charts

GBPAUD Elliott Wave Forecast: British Pound Australian Dollar Corrective Structure and Trading Opportunities Using Technical Charts

gbpaud forecast, gbpaud analysis, elliott wave, trading strategy, corrective wave, bearish trend, pr...

Read More >

$1 for 2 Weeks

then $29 a month!

What a Special Offer!

Trade Recommendations

Unleash the power of deversified trading with our comprehensive portfolio, covering 250+ markets:

  • Stock Trades
  • Crypto Trades
  • Forex Trades
  • Commodity Trades
Elliott Wave Analysis

Gain a competitive edge with expert insights and AI-powered Elliott Wave charting into:

  • Global Indices
  • US Stocks & ASX Stocks
  • Forex & Crypto
  • Commodities
Top-Notch Trading Tools

Equip yourself with the tools of success:

  • Real-time Chat rooms
  • Elliott Wave Algorithm
  • Portfolio tools
  • TradingLevels
  • Screener
  • Trading Game
7 Elliott Wave Analysts

Stay ahead of the market with daily charts and insightful videos
Your secret to strategic trading!

JOIN HERE


Welcome to TradingLounge (ASIC A.R.No. 321187), specialists in trades, trading education and technical analysis, covering stocks, indices, commodities, forex and cryptocurrencies.

When you join TradingLounge you have access to everything we offer, including trade tools, educational content and a social platform to chat with like-minded investors.

Read more

@Copyright 2024 by tradinglounge.com

Contact Us

Australian no: 02 4787 6020

International no: +61 (2) 47876020

Pay with:

Find us on