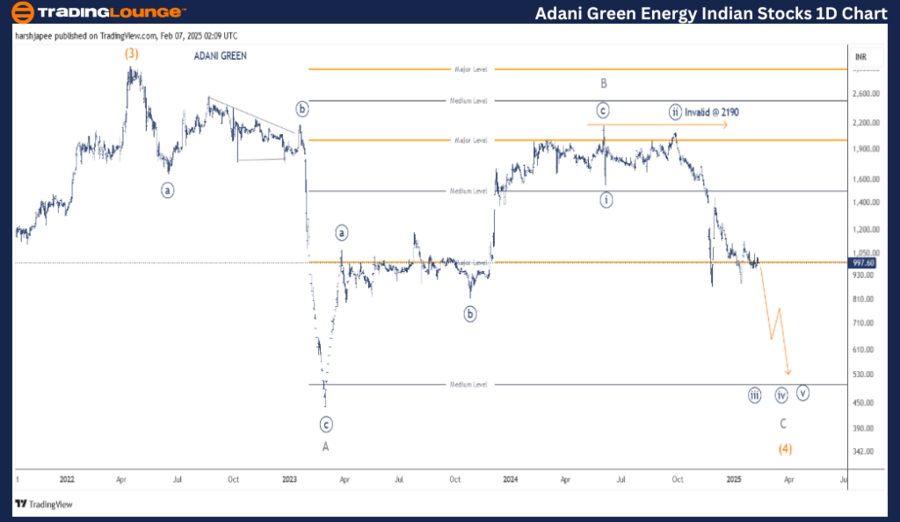
ADANI GREEN ENERGY – ADANIGREEN Elliott Wave Analysis 1D Chart
ADANIGREEN Elliott Wave Analysis
Function: Counter Trend (Intermediate Degree, Orange)
Mode: Corrective
Structure: Flat
Position: Minor Wave C (Grey)
Adani Green Energy Technical Analysis & Key Insights
Elliott Wave Count Analysis
ADANI GREEN ENERGY's daily chart suggests the stock is undergoing a corrective phase after peaking at 3060 in April 2022. The Minor Waves A and B appear completed at 440 and 2190 levels, respectively. Currently, bears are aiming to extend Minor Wave C lower.
If the stock price drops below 875, further downside pressure is expected, accelerating towards the final wave termination near 400 levels. Conversely, a bullish breakout above 1550 would negate the current bearish bias and warrant a fresh Elliott Wave analysis.
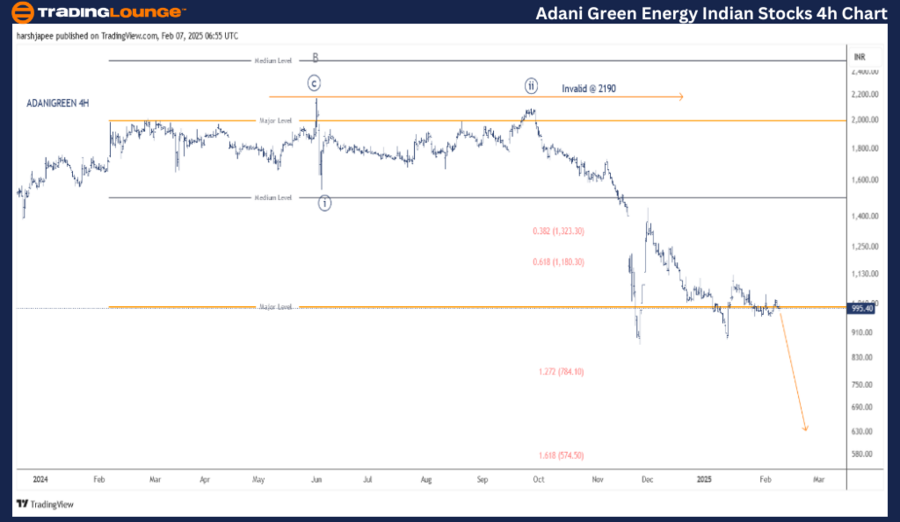
ADANI GREEN ENERGY – ADANIGREEN (4H Chart) Elliott Wave Technical Analysis
Function: Counter Trend (Intermediate Degree, Orange)
Mode: Corrective
Structure: Flat
Position: Minor Wave C (Grey)
Technical Analysis & Key Insights
- Current Wave Movement: Minor Wave C (Grey) continues to unfold, with its structure aligning as an impulse pattern, aiming to complete Intermediate Wave (4) Orange.
- Subwave Analysis:
- Minute Waves ((i)) and ((ii)) formed near 1550 and 2100.
- Minute Wave ((iii)) is currently progressing downward, likely approaching 577 levels.
- Minuette waves (not labeled) are contributing to the downward push within Minute Wave ((iii)).
- Key Levels to Watch:
- Target for Minute Wave ((iii)): 566
- Bearish Confirmation Level: 875
- Final Wave Termination: Expected around 400 levels
- Invalidation Point: 2190
Elliott Wave Count Analysis
The 4-hour chart shows a clear bearish progression post Minor Wave B completion near 2190 in May 2024. Minute Wave ((iii)) is actively extending lower, potentially breaking the 577 level before finalizing Minor Wave C.
A significant drop below 875 could strengthen the bearish momentum, leading towards 400 as a final downside target for Intermediate Wave (4). However, if the price rebounds above 1550, it would invalidate the current bearish structure, requiring a reassessment of wave positioning.
Technical Analyst: Harsh Japee
Source: visit Tradinglounge.com and learn From the Experts Join TradingLounge Here
Previous: BAJAJ AUTO Elliott Wave Technical Analysis
VALUE Offer - Buy 1 Month & Get 3 Months!Click here
Access 7 Analysts Over 200 Markets Covered. Chat Room With Support
Conclusion:
ADANI GREEN ENERGY is currently in a corrective phase, moving lower towards 400 levels within Minor Wave C of Intermediate Wave (4) Orange. Key levels 2190 (invalidation), 875 (breakout confirmation), and 400 (final bearish target) should be closely monitored.