03Feb

Bajaj Auto Stock and Elliott Wave technical Analysis: Identifying key Support and Resistance levels, and potential trading opportunities

BAJAJ AUTO Elliott Wave Technical Analysis - (1D Chart)

BAJAJAUTO Elliott Wave Technical Analysis

Function: Counter Trend (Minor Degree, Grey)

Mode: Corrective

Structure: Impulse within a larger corrective structure

Position: Minor Wave 2 (Grey)

Details: Minor Wave 2 appears to be unfolding near the 10,000 mark.

Invalidation Point: 12,900

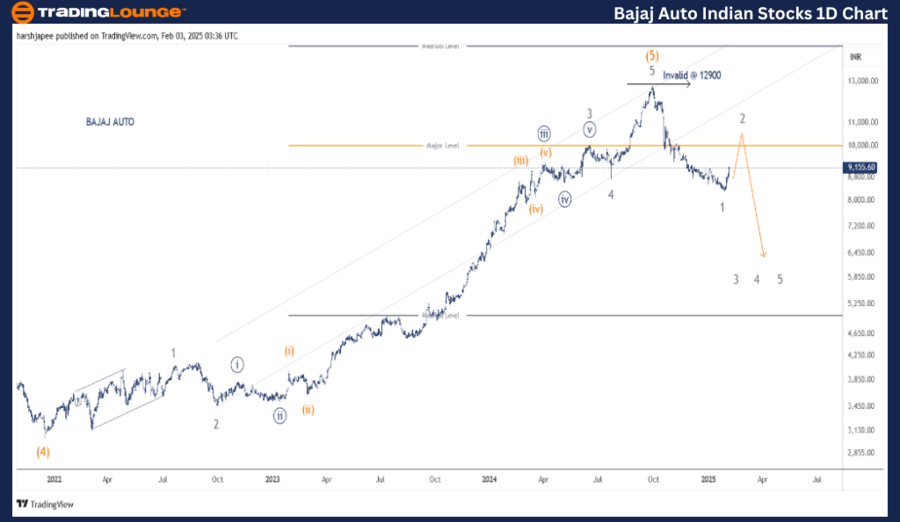
BAJAJ AUTO Daily Chart: Elliott Wave Analysis and Key Levels

The BAJAJ AUTO daily chart indicates a significant top around the 12,900 mark. The stock has declined impulsively, breaking below 8,400, marking the completion of Wave 1. It is currently undergoing a corrective phase towards the 10,000 level before a potential bearish resumption.

In December 2021, the stock dropped to 3,030, completing Intermediate Wave (4) Orange. The subsequent rally was impulsive, subdividing into five waves at the Minor degree, reaching the 12,900 mark.

Now, the price action suggests a larger-degree correction from the 12,900 highs. The sub-waves indicate that Minor Wave 1 completed near 8,400, while Minor Wave 2 is developing towards 10,000. If this scenario holds, Wave 3 may resume lower soon.

BAJAJ-AUTO-Indian-St...


BAJAJ AUTO – BAJAJAUTO (4H Chart) Elliott Wave Technical Analysis

Function: Counter Trend (Minor Degree, Grey)

Mode: Corrective

Structure: Impulse within a larger corrective structure

Position: Minor Wave 2 (Grey)

Details: Minor Wave 1 was an impulse subdividing into five waves at Minute Degree, terminating near 8,345. Minor Wave 2 is now progressing towards 10,000.

Invalidation Point: 12,900

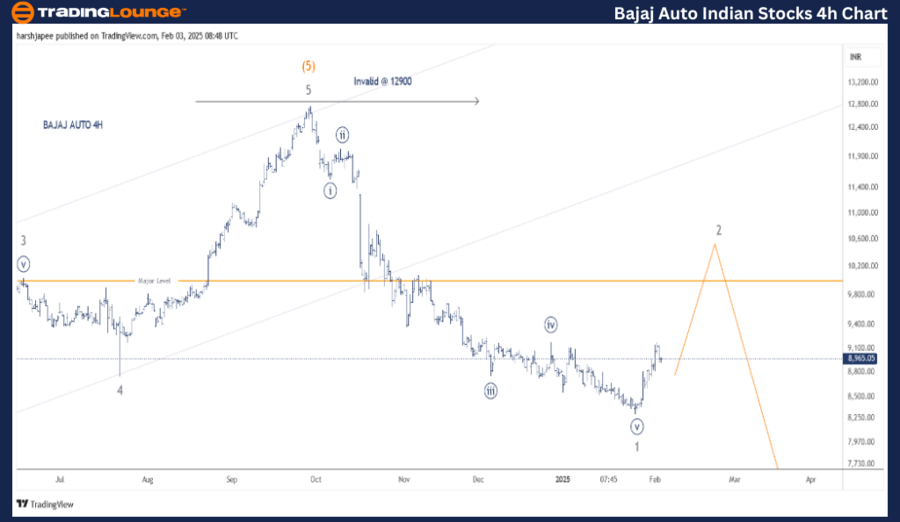
BAJAJ AUTO 4H Chart: Elliott Wave Analysis and Key Levels

The 4-hour chart highlights price action following Minor Wave 3 of the broader trend, which ended near 10,070. Subsequently, Minor Wave 4 found support around 8,775 in July 2024, before an impulsive Wave 5 pushed the stock to 12,900, marking a potential top.

The price has since dropped in an impulsive Wave 1, completing just below 8,400. The current movement suggests a corrective Wave 2, retracing towards 10,000 before Wave 3 resumes the downward trend.

Technical Analyst: Harsh Japee

Source: visit Tradinglounge.com and learn From the Experts Join TradingLounge Here 

Previous: GRASIM INDUSTRIES Elliott Wave Technical Analysis

VALUE Offer - Buy 1 Month & Get 3 Months!Click here

Access 7 Analysts Over 200 Markets Covered. Chat Room With Support

BAJAJ-AUTO-Indian-St...


Conclusion

BAJAJ AUTO is currently forming Minor Wave 2, likely advancing towards 10,000, before resuming its downward trend. The invalidation level remains at 12,900. If this structure holds, Wave 3 may soon push the stock lower.

Related

Natural Gas Elliott Wave Technical Analysis 12 February 24 Market Trends, Trading Strategies

Natural Gas Elliott Wave Technical Analysis 12 February 24 Market Trends, Trading Strategies

In this comprehensive Natural Gas Elliott Wave Analysis for February 12, traders gain valuable insig...

Read More >
Costco Wholesale Corp.(COST:NASDAQ) Elliott Wave Technical Analysis 10 January 24

Costco Wholesale Corp.(COST:NASDAQ) Elliott Wave Technical Analysis 10 January 24

Costco Wholesale Corp.(COST: NASDAQ) Elliott Wave Technical Analysis Dated 10 January 24 with 4-Hour...

Read More >
 Commonwealth Bank of Australia stock on the ASX: CBA Stock Analysis & Elliott Wave Technical Forecast

Commonwealth Bank of Australia stock on the ASX: CBA Stock Analysis & Elliott Wave Technical Forecast

This article comprehensively analyses Commonwealth Bank of Australia (CBA) stock on the ASX, utilizi...

Read More >
Looking to Buy the Best NASDAQ Stocks or Explore NDX ETFs With NASDAQ Index Elliott Wave Technical Analysis

Looking to Buy the Best NASDAQ Stocks or Explore NDX ETFs With NASDAQ Index Elliott Wave Technical Analysis

Gain valuable insights into NASDAQ Composite trading with our Elliott Wave analysis. Discover expert...

Read More >
AUDUSD Elliott Wave Technical Analysis: Bearish Trend, Key Levels, Gray Wave 3 Progression, and Price Forecast

AUDUSD Elliott Wave Technical Analysis: Bearish Trend, Key Levels, Gray Wave 3 Progression, and Price Forecast

The AUDUSD analysis reveals a strong bearish trend based on the Elliott Wave theory. Gray wave 3 and...

Read More >
British Pound/Japanese Yen(GBPJPY) Elliott Wave Technical Analysis: Insightful Market Outlook for February 8, 2024

British Pound/Japanese Yen(GBPJPY) Elliott Wave Technical Analysis: Insightful Market Outlook for February 8, 2024

The provided text offers an in-depth analysis of the GBPJPY currency pair using Elliott Wave princip...

Read More >

Buy 1 Month

Get 3 Months!

Special Offer:

Trade Recommendations

Unleash the power of deversified trading with our comprehensive portfolio, covering:

  • Stock Trades
  • Crypto Trades
  • Forex Trades
  • Commodity Trades
Elliott Wave Analysis

Gain a competive edge with expert insights in to:

  • Global Indices
  • US Stocks & ASX Stocks
  • Forex & Crypto
  • Commodities
Top-Notch Trading Tools

Equip yourself with the tools of success:

  • Social Chat
  • Elliott Wave Algorithm
  • Screener
  • TradingLevels
  • Trading Game
7 Elliott Wave Analysts

Stay ahead of the market with daily charts and insightful videos
-Your secret to strategic trading!

JOIN HERE


Welcome to TradingLounge (ASIC A.R.No. 321187), specialists in trades, trading education and technical analysis, covering stocks, indices, commodities, forex and cryptocurrencies.

When you join TradingLounge you have access to everything we offer, including trade tools, educational content and a social platform to chat with like-minded investors.

Read more

@Copyright 2024 by tradinglounge.com

Contact Us

Australian no: 02 4787 6020

International no: +61 (2) 47876020

Pay with:

Find us on