Welcome to Our Latest Elliott Wave Analysis for Visa Inc. (V)

This analysis offers an in-depth examination of Visa's price movements through the lens of Elliott Wave Theory. Our goal is to help traders identify potential opportunities by analyzing current trends and market structures. We will cover insights from both the daily and 4-hour charts to provide a comprehensive view of Visa's market behavior.

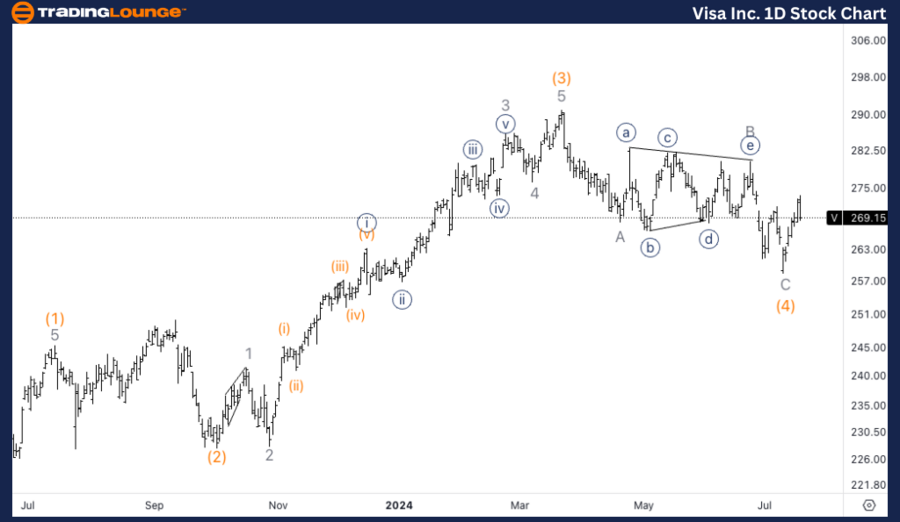
V Elliott Wave Analysis Trading Lounge Daily Chart

Visa Inc. (V) Daily Chart Analysis

Visa Stock Technical Analysis

FUNCTION: Trend

MODE: Impulsive

STRUCTURE: Motive

POSITION: Wave 1

DIRECTION: Upside in wave 1

DETAILS: We are looking for a bottom in wave (4) to be in place after what appears to be a clear three-wave move. This move reached the equality of wave C versus wave A, which is a common target for wave C.

V Elliott Wave Technical Analysis – Daily Chart

The daily chart suggests that a bottom in wave (4) might be in place, following a clear three-wave corrective move. This move reached the equality of wave C versus wave A, which is a common target for wave C. With wave (4) potentially complete, we anticipate the start of wave 1's upside movement.

Visa-Inc-Day-Stock-C...


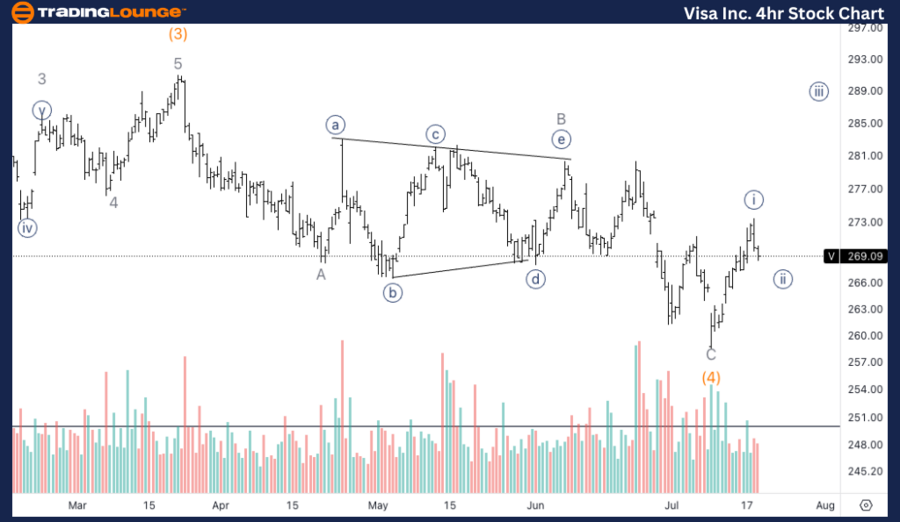
V Elliott Wave Analysis Trading Lounge 4Hr Chart

Visa Inc. (V) 4Hr Chart Analysis

V Elliott Wave Technical Analysis

FUNCTION: Trend

MODE: Impulsive

STRUCTURE: Motive

POSITION: Wave {i} of 1

DIRECTION: Upside in wave {iii}

DETAILS: We are looking for a clear five-wave move into Minor wave 1 to break the $280 level and provide additional upside confirmation.

V Elliott Wave Analysis – 4Hr Chart

The 4-hour chart indicates that we are looking for a clear five-wave move into Minor wave 1. Breaking above the $280 level will provide additional upside confirmation and signal the continuation of wave {iii} of 1. Traders should monitor the price action closely for this breakout to validate the bullish scenario.

Technical Analyst: Alessio Barretta

Source: visit Tradinglounge.com and learn From the Experts Join TradingLounge Here 

See Previous: Advanced Micro Devices Inc. (AMD) Ellott Wave Technical Analysis

Special Trial Offer - 0.76 Cents a Day for 3 Months! Click here

Access 7 Analysts Over 170 Markets Covered. Chat Room With Support

Visa-Inc-4hr-Stock-C...

Related

COCHLEAR LIMITED COH Elliott Wave Analysis Forecasts Wave 3 Rally With $300/$350 Targets & $246.52 Invalidation – ASX Strategy

COCHLEAR LIMITED COH Elliott Wave Analysis Forecasts Wave 3 Rally With $300/$350 Targets & $246.52 Invalidation – ASX Strategy

Elliott Wave analysis of COCHLEAR LIMITED (ASX:COH) highlights completion of Wave 2 correction with ...

Read More >
Cocoa Market Forecast 2024: Elliott Wave Technical Analysis, Trends, and Trading Opportunities

Cocoa Market Forecast 2024: Elliott Wave Technical Analysis, Trends, and Trading Opportunities

This analysis delves into the 2024 cocoa market using Elliott Wave theory. It highlights recent pric...

Read More >
Alphabet Inc. Elliott Wave Forecast: Unveils GOOGL’s Impulse Wave iii Breakout Potential on Daily and 1‑Hour Charts

Alphabet Inc. Elliott Wave Forecast: Unveils GOOGL’s Impulse Wave iii Breakout Potential on Daily and 1‑Hour Charts

A bullish Elliott Wave analysis on Alphabet Inc (GOOGL) shows wave ii nearing end and potential for ...

Read More >
Eicher Motors Elliott Wave Analysis: Bullish Stock Forecast, Trading Strategy, Share Price Prediction, and Market Insights

Eicher Motors Elliott Wave Analysis: Bullish Stock Forecast, Trading Strategy, Share Price Prediction, and Market Insights

This Eicher Motors Elliott Wave analysis shows a bullish trend with technical forecasts, trading str...

Read More >
Bullish Momentum in NIKKEI 225: Elliott Wave Technical Analysis and Key Trading Levels

Bullish Momentum in NIKKEI 225: Elliott Wave Technical Analysis and Key Trading Levels

The NIKKEI 225 index is experiencing a bullish trend, supported by impulsive Elliott Wave patterns. ...

Read More >
"Elliott Wave Analysis of Key Indices: S&P 500, NASDAQ 100, Russell 2000, DJI, DAX 40, FTSE 100, ASX 200, and Nikkei"

"Elliott Wave Analysis of Key Indices: S&P 500, NASDAQ 100, Russell 2000, DJI, DAX 40, FTSE 100, ASX 200, and Nikkei"

"Delve into our detailed Elliott Wave Analysis of the Stock Market, focusing on key indices i...

Read More >

$1 for 2 Weeks

then $29 a month!

What a Special Offer!

Trade Recommendations

Unleash the power of deversified trading with our comprehensive portfolio, covering 250+ markets:

  • Stock Trades
  • Crypto Trades
  • Forex Trades
  • Commodity Trades
Elliott Wave Analysis

Gain a competitive edge with expert insights and AI-powered Elliott Wave charting into:

  • Global Indices
  • US Stocks & ASX Stocks
  • Forex & Crypto
  • Commodities
Top-Notch Trading Tools

Equip yourself with the tools of success:

  • Real-time Chat rooms
  • Elliott Wave Algorithm
  • Portfolio tools
  • TradingLevels
  • Screener
  • Trading Game
7 Elliott Wave Analysts

Stay ahead of the market with daily charts and insightful videos
Your secret to strategic trading!

JOIN HERE


Welcome to TradingLounge (ASIC A.R.No. 321187), specialists in trades, trading education and technical analysis, covering stocks, indices, commodities, forex and cryptocurrencies.

When you join TradingLounge you have access to everything we offer, including trade tools, educational content and a social platform to chat with like-minded investors.

Read more

@Copyright 2024 by tradinglounge.com

Contact Us

Australian no: 02 4787 6020

International no: +61 (2) 47876020

Pay with:

Find us on