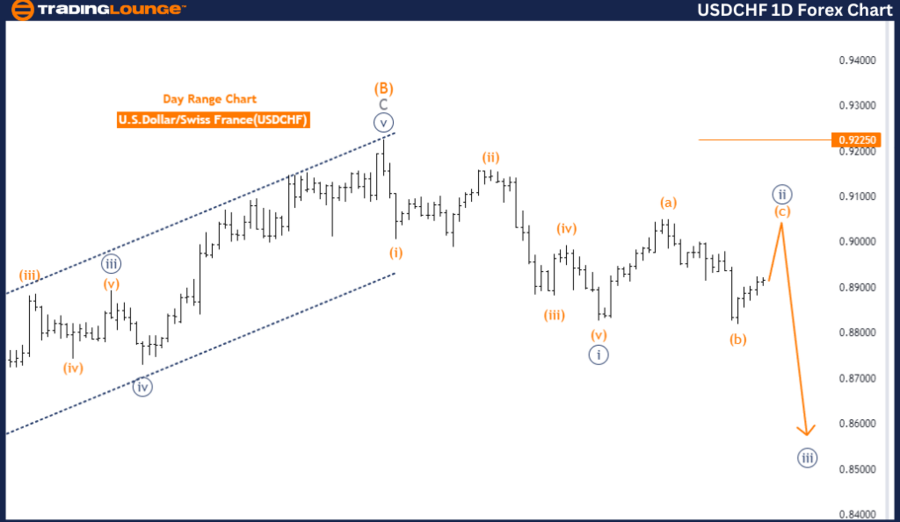
TradingLounge Forex USDCHF Elliott Wave Analysis - Daily Chart
USDCHF Day Chart Elliott Wave Analysis
USDCHF Elliott Wave Technical Analysis
Function: Counter Trend
Mode: Corrective
Position: Navy blue wave 2
Structure: Gray wave 1
Next Lower Degrees: Navy blue wave 3
The daily USDCHF Elliott Wave analysis delves into market dynamics using Elliott Wave Theory. The current movement is identified as a counter trend, indicating a corrective phase rather than a continuation of the main trend.
This wave's mode is corrective, suggesting the market is adjusting previous impulsive movements. The focus is currently on navy blue wave 2, signaling a significant correction following the initial impulsive phase, designated as gray wave 1.
As the market nears the conclusion of the navy blue wave 2 correction, there is an anticipation of a shift towards navy blue wave 3. This phase usually brings strong and directional price action, signifying a significant market shift.
The ongoing formation of navy blue wave 2 shows a flat correction pattern, characterized by sideways movement, reflecting market indecision and a temporary balance between buyers and sellers. This phase is approaching its end, paving the way for the next impulsive movement.
A crucial aspect of this analysis is the wave cancellation invalidation level at 0.92250. If the market dips below this point, the current wave analysis would be invalidated, necessitating a reassessment of the wave structure.
Summary: The USDCHF daily chart shows a corrective phase marked as navy blue wave 2, following the impulsive gray wave 1. The next anticipated move is towards navy blue wave 3, an impulsive phase. The critical level for validating the current wave analysis is set at 0.92250.
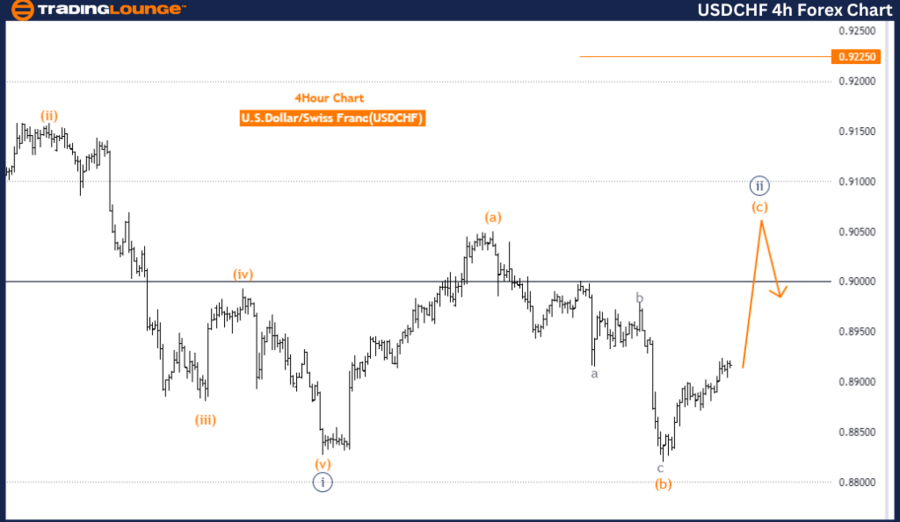
TradingLounge Forex USDCHF Elliott Wave Analysis - 4-Hour Chart
USDCHF 4-Hour Chart Elliott Wave Analysis
USDCHF Elliott Wave Technical Analysis
Function: Counter Trend
Mode: Corrective
Position: Orange wave C
Structure: Navy blue wave 2
Next Lower Degrees: Navy blue wave 3
The 4-hour USDCHF Elliott Wave analysis provides insights into market behavior using Elliott Wave Theory. The current market movement is categorized as a counter trend, indicating a corrective phase rather than the continuation of the primary trend.
The wave currently under analysis is orange wave C, part of a corrective sequence following the conclusion of orange wave B. This suggests the market has completed a corrective wave B and is now in the final leg of the correction with wave C.
The broader structure includes navy blue wave 2, typically a corrective phase following an initial impulsive wave 1, indicating a significant market correction after completing the first impulsive wave of a larger cycle.
The analysis points towards the next lower degrees, suggesting the direction is towards navy blue wave 3. After the current corrective phase (navy blue wave 2) concludes, the market is expected to enter an impulsive phase, identified as navy blue wave 3, often characterized by strong and directional price movements.
The ongoing phase, orange wave C of 2, indicates the market is in the final stages of this correction before potentially resuming the main trend. An essential aspect of this analysis is the wave cancellation invalidation level at 0.92250. If the market falls below this point, the current wave analysis would be invalidated, requiring a reevaluation of the wave structure.
Summary: The USDCHF 4-hour chart analysis indicates a corrective phase, labeled as orange wave C within navy blue wave 2. The next expected movement is a transition into navy blue wave 3, marking an impulsive phase. The critical level for validating the current wave analysis is set at 0.92250.
Technical Analyst: Malik Awais
Source: visit Tradinglounge.com and learn From the Experts Join TradingLounge Here
Previous: EURUSD Elliott Wave Technical Analysis
Special Trial Offer - 0.76 Cents a Day for 3 Months! Click here
Access 7 Analysts Over 170 Markets Covered. Chat Room With Support