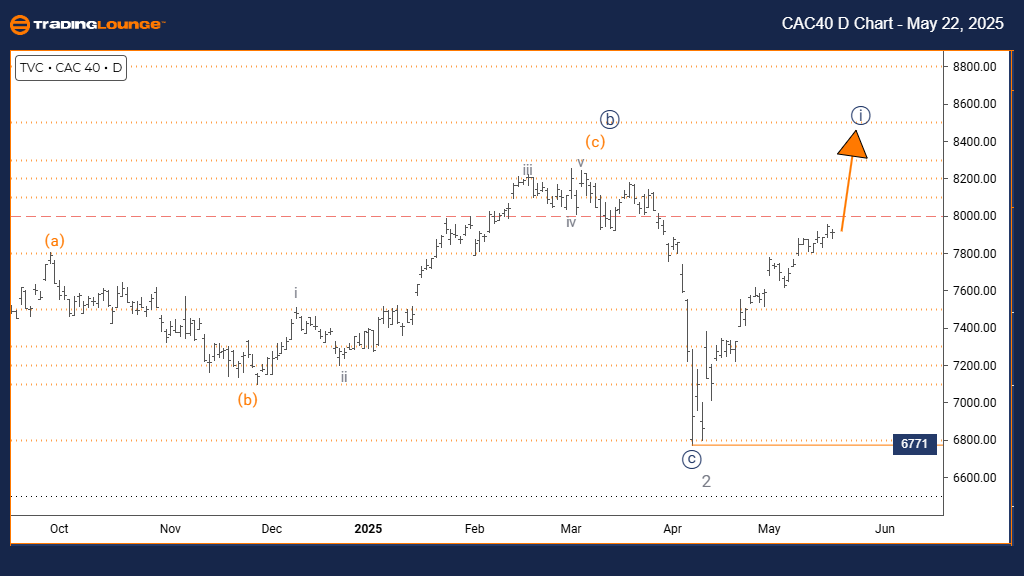
CAC 40 (France) Elliott Wave Analysis – Trading Lounge Daily Chart
CAC 40 (France) Elliott Wave Technical Analysis
Function: Bullish Trend
Mode: Impulsive
Structure: Navy Blue Wave 1
Position: Gray Wave 3
Direction Next Lower Degrees: Navy Blue Wave 2
Details: Completion of gray wave 2 appears confirmed. Progression into navy blue wave 1 of 3 is underway. Invalidation level: 6771
The daily Elliott Wave analysis of the CAC 40 index signals a strong upward trend, supported by bullish market momentum. The index is currently developing navy blue wave 1 within gray wave 3, suggesting that gray wave 2's corrective phase has ended. This positions the index within an early-stage impulsive move, often associated with accelerated gains.
With the transition to navy blue wave 1 confirmed, the bullish structure gains strength. The impulse phase highlights increased buying pressure, and further gains are possible as this wave unfolds. The critical invalidation level is at 6771; if broken, it may suggest a shift toward a more complex correction or even a trend reversal.
This chart setup provides investors with a clear picture of where the CAC 40 stands in its broader market cycle. The index is expected to continue its upward trajectory during this segment, with navy blue wave 2 anticipated as the next corrective move. Traders should monitor for continuation patterns and manage exposure ahead of wave one's eventual conclusion.
Effective risk strategies are vital during the early stages of this bullish wave. While the current setup supports continued upside, protective measures should remain in place. The initial phase of a larger impulsive wave implies robust market strength, likely to influence near-term price action.
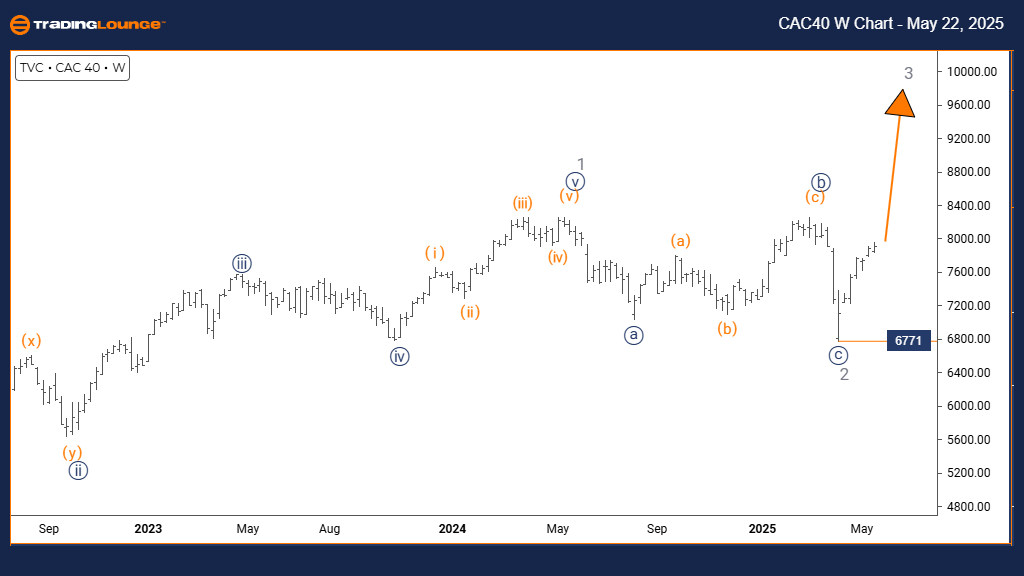
CAC 40 (France) Elliott Wave Analysis – Trading Lounge Weekly Chart
CAC 40 (France) Elliott Wave Technical Analysis
Function: Bullish Trend
Mode: Impulsive
Structure: Gray Wave 3
Position: Orange Wave 1
Direction Next Higher Degrees: Gray Wave 3 (In Progress)
Details: Gray wave 2 appears finalized. Gray wave 3 is currently developing. Invalidation level: 6771
The weekly Elliott Wave outlook for CAC 40 shows a continuation of its bullish trend, now structured within a larger impulsive formation. Gray wave 3 has commenced, confirming the end of gray wave 2's correction and beginning a potentially extended rally phase. This segment is often characterized by sustained strength and market optimism.
The initiation of gray wave 3 is evident, suggesting that institutional accumulation may be driving this move. As one of the strongest waves in Elliott theory, this segment can offer substantial upside before the next corrective pattern forms. It signals an essential part of the broader bullish market cycle.
For investors, this longer-term chart provides clarity on the CAC 40's trend direction. The index appears positioned for prolonged gains during this stage of gray wave 3. However, like all impulsive waves, a pullback remains likely later in the sequence. This reinforces the need to monitor potential exhaustion points.
Traders should remain focused on spotting bullish continuation signals while keeping risk management strategies active. The 6771 invalidation level remains crucial; any breach would necessitate a reevaluation of the bullish scenario. The weekly analysis supports further upward potential, but with attention to developing corrective structures.
Technical Analyst: Malik Awais
Source: Visit Tradinglounge.com and learn from the Experts. Join TradingLounge Here
Previous: SWISS MARKET INDEX Elliott Wave Technical Analysis
VALUE Offer - Buy 1 Month & Get 3 Months!Click here
Access 7 Analysts Over 200 Markets Covered. Chat Room With Support