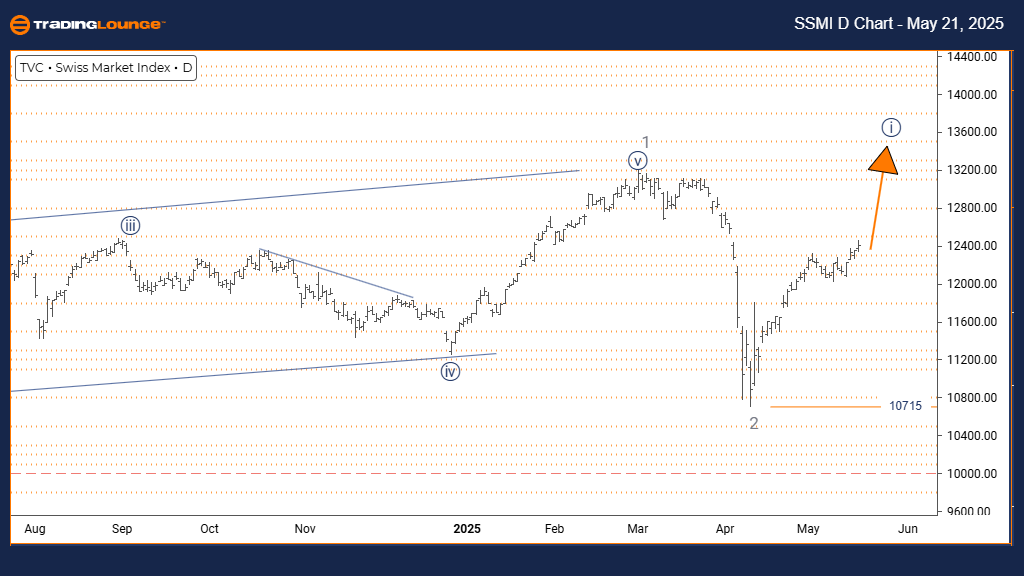
SWISS MARKET INDEX – Elliott Wave Analysis | Trading Lounge Day Chart
SWISS MARKET INDEX Wave Technical Analysis
FUNCTION: Trend
MODE: Impulsive
STRUCTURE: Navy blue wave 1
POSITION: Gray wave 3
DIRECTION NEXT LOWER DEGREES: Navy blue wave 2
DETAILS: Completion of gray wave 2; formation of navy blue wave 1 of 3 has started.
Invalidation Level: 10715
The Swiss Market Index (SMI) daily chart displays sustained bullish momentum, aligning with a clear upward Elliott Wave pattern. The ongoing development of navy blue wave 1, nested inside gray wave 3, follows the completion of a corrective gray wave 2 structure—signaling the beginning of a stronger bullish cycle.
With navy blue wave 1 now active, market conditions reflect growing bullish interest, reinforcing expectations of continued gains. The impulsive nature of this wave implies an upward extension remains likely. However, a break above the 10715 invalidation level would contradict the current wave count.
This Elliott Wave analysis offers a valuable snapshot of the SMI’s trend direction, helping traders prepare for short-term fluctuations. As navy blue wave 1 progresses, the anticipated next move is a corrective navy blue wave 2, potentially offering reentry points in a broader uptrend. Close monitoring for confirmation of bullish momentum is advised.
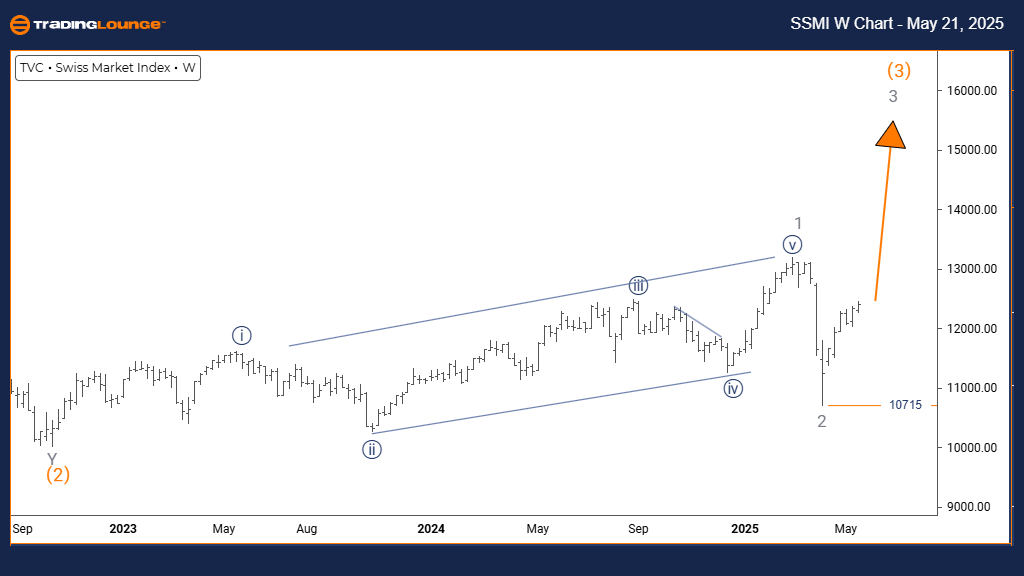
SWISS MARKET INDEX – Elliott Wave Analysis | Trading Lounge Weekly Chart
SWISS MARKET INDEX Wave Technical Analysis
FUNCTION: Trend
MODE: Impulsive
STRUCTURE: Gray wave 3
POSITION: Orange wave 3
DIRECTION NEXT HIGHER DEGREES: Gray wave 3 continuation
DETAILS: Gray wave 2 is complete; gray wave 3 progression is underway.
Invalidation Level: 10715
The weekly chart for the Swiss Market Index (SMI) presents a strong bullish structure, typical of a developing impulse wave 3. The formation of gray wave 3 within the broader orange wave 3 framework confirms a solid uptrend, following the confirmed completion of gray wave 2.
This phase of Elliott Wave development often sees the most notable price advances. Rising demand from institutional investors is pushing momentum higher, with orange wave 3 facilitating an extended bullish cycle.
This higher-timeframe Elliott Wave interpretation helps investors align with the SMI’s long-term trend. With gray wave 3 gaining traction, the potential for sustained market growth increases. While pullbacks will occur, this current stage typically rewards trend-following strategies.
Technical Analyst: Malik Awais
Source: Visit Tradinglounge.com and learn from the Experts. Join TradingLounge Here
Previous: Shanghai Composite Elliott Wave Technical Analysis
VALUE Offer - Buy 1 Month & Get 3 Months!Click here
Access 7 Analysts Over 200 Markets Covered. Chat Room With Support