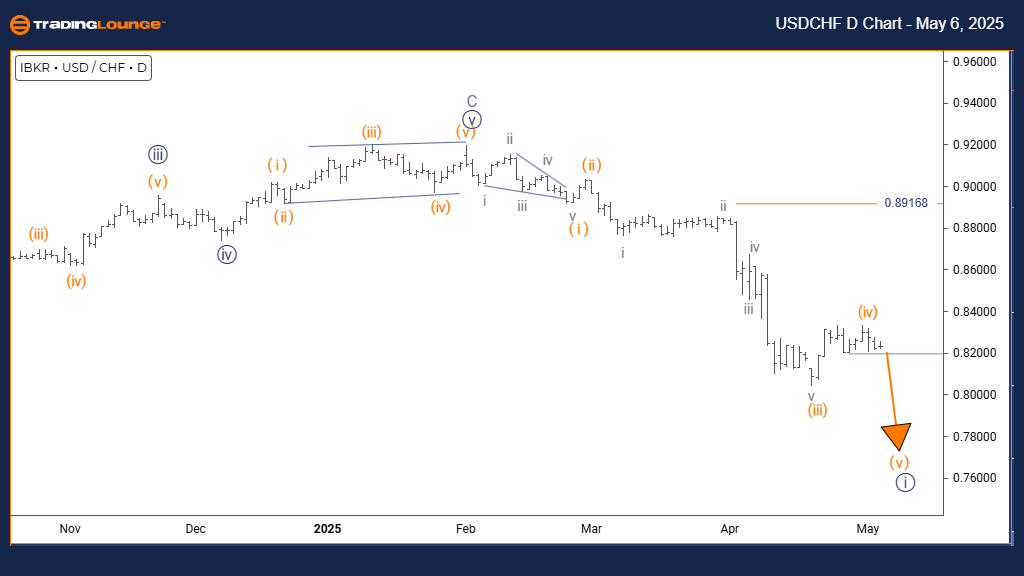
U.S. Dollar / Swiss Franc (USDCHF) Daily Chart
USDCHF Elliott Wave Technical Analysis
Function: Trend
Mode: Impulsive
Structure: Orange wave 5
Position: Navy blue wave 1
Direction Next Higher Degree: Navy blue wave 2
Details: Completion of orange wave 4 and active progression into orange wave 5.
Wave Cancel Invalidation Level: 0.89168
The USDCHF daily chart presents a strong impulsive trend based on the Elliott Wave principle. The market has finalized its orange wave 4 correction and is actively advancing into orange wave 5 within the broader navy blue wave 1 structure. This movement signals the last bullish surge before a broader correction phase.
Orange wave 5 serves as the concluding upward push in the sequence, typically characterized by either strengthening or waning momentum. With the correction phase completed, the USDCHF pair prepares for a final test of previous highs, aligning with classic Elliott Wave behaviors before a potential trend reversal. The current Elliott Wave pattern points toward the final development phase of the impulsive move.
The daily time frame offers critical insights into the structure, suggesting the pair is nearing the end of its short-term bullish trend. Moving into navy blue wave 1 implies that a higher degree bullish framework might continue after a necessary correction. Traders should observe typical end-wave signs, such as momentum divergence or reversal patterns.
The invalidation level stands at 0.89168. If prices drop below this point, the current bullish Elliott Wave outlook will be invalidated, prompting a reassessment of the structure. This support level protects the low of orange wave 4 and remains crucial for maintaining the bullish forecast.
Following the conclusion of orange wave 5, a corrective move into navy blue wave 2 is anticipated. This pullback phase offers potential trading opportunities before the broader trend continues. Monitoring key technical indicators and price behavior is essential to accurately capture the transition from the current bullish impulse to the next correction phase.
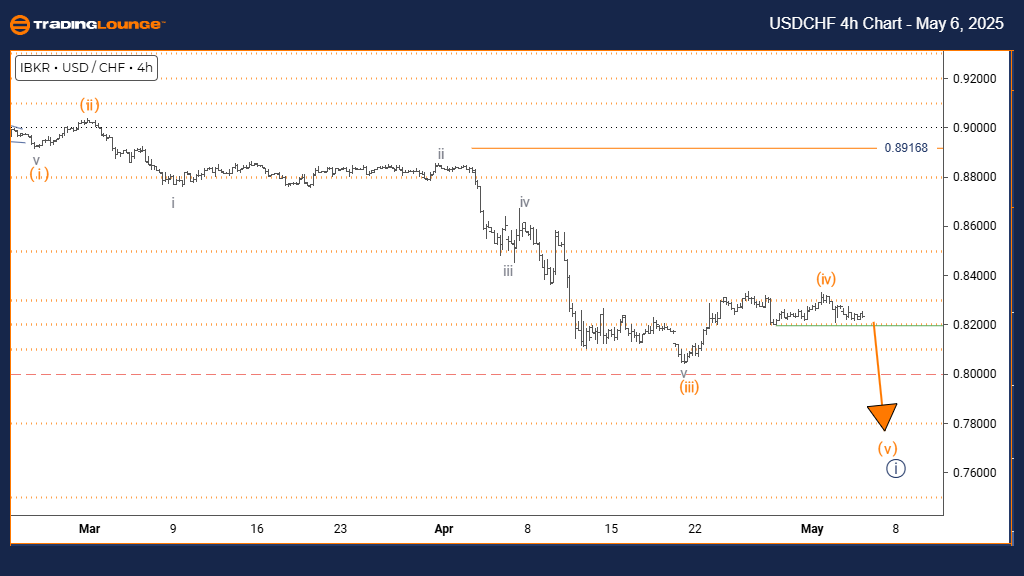
U.S. Dollar / Swiss Franc (USDCHF) 4-Hour Chart
USDCHF Elliott Wave Technical Analysis
Function: Trend
Mode: Impulsive
Structure: Orange wave 5
Position: Navy blue wave 1
Direction Next Lower Degree: Orange wave 5 (ongoing)
Details: Completion of orange wave 4 and initiation of orange wave 5.
Wave Cancel Invalidation Level: 0.89168
The USDCHF 4-hour chart illustrates a clear impulsive trend within the Elliott Wave framework. After completing its orange wave 4 correction, the pair is now progressing through orange wave 5 inside the larger navy blue wave 1 formation. This move highlights the final leg of the ongoing bullish trend before a corrective phase initiates.
Orange wave 5 denotes the terminal stage of the current advance, often showing either robust momentum or early signs of weakening. With wave 4 completed, USDCHF is poised for a final push, potentially breaking above previous resistance levels before the trend wanes. Current developments suggest that the bullish sequence may soon complete.
Upon the completion of orange wave 5, the market is expected to enter navy blue wave 2, initiating a corrective structure. An important invalidation point remains at 0.89168; any decline beneath this level would necessitate a revision of the Elliott Wave count and broader market analysis.
Traders should remain vigilant for classic termination features, including bearish divergences in momentum indicators or emerging
reversal formations. The 4-hour chart provides essential detail, suggesting the trend is nearing its peak. Monitoring wave 5 behavior is crucial for catching potential trend exhaustion and preparing for the corrective phase.
Technical indicators combined with disciplined price action analysis are key for recognizing when the current bullish impulse slows and when corrective wave 2 begins. Respecting the invalidation level and carefully watching for trend completion will enhance trade management during this transitional period.