EURUSD Elliott Wave Analysis Trading Lounge Day Chart
Euro/ U.S. Dollar (EURUSD) Day Chart
EURUSD Elliott Wave Technical Analysis
Function: Bullish Trend
Mode: Impulsive
Structure: Orange wave 5
Position: Navy Blue Wave 3
Next Lower Degree Direction: Navy blue wave 4
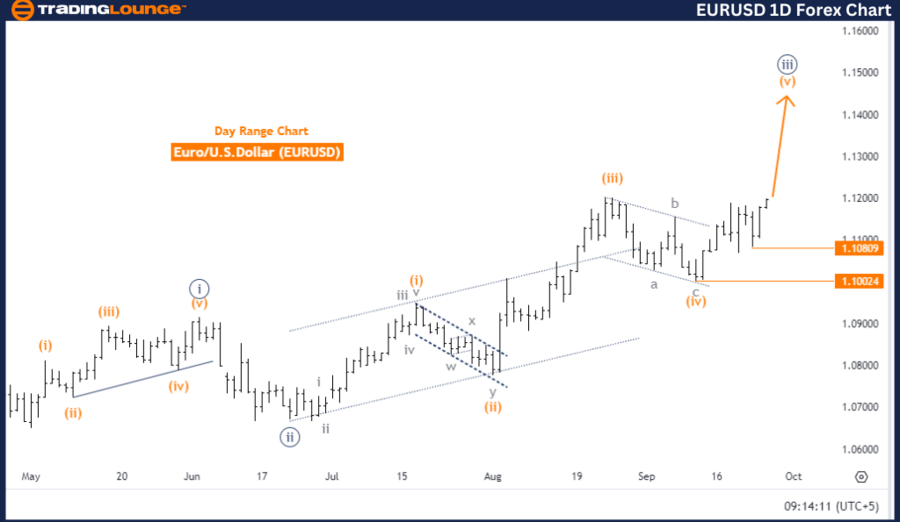
Details: Orange wave 4 seems complete, with orange wave 5 in progress.
Wave Cancellation Invalid Level: 1.10809
The EURUSD Elliott Wave analysis on the daily chart suggests a bullish trend, driven by an impulsive wave pattern. The current wave structure is identified as orange wave 5, nested within navy blue wave 3. This positioning reflects the market being in the third wave of a higher-degree sequence, which often signals strong upward momentum.
Before this wave, orange wave 4 appears to have ended, completing a corrective phase. With the start of orange wave 5, the market enters the final stage of the impulsive sequence. Typically, this wave continues the existing trend but may decelerate as the market nears a potential peak. The analysis highlights a critical invalidation level at 1.10809, which acts as a pivotal point for the current wave count. If the price reaches this level, the wave pattern could be invalidated, suggesting a possible shift in market direction.
Summary:
The EURUSD is currently moving upward, led by orange wave 5 within the broader context of navy blue wave 3. The completion of orange wave 4 indicates the continuation of the bullish trend. However, traders should be cautious around the invalidation level of 1.10809, as breaching this point could challenge the existing wave structure.
Euro/ U.S. Dollar (EURUSD) 4-Hour Chart
EURUSD Elliott Wave Technical Analysis
Function: Bullish Trend
Mode: Impulsive
Structure: Gray wave 3
Position: Orange wave 5
Next Lower Degree Direction: Gray wave 4
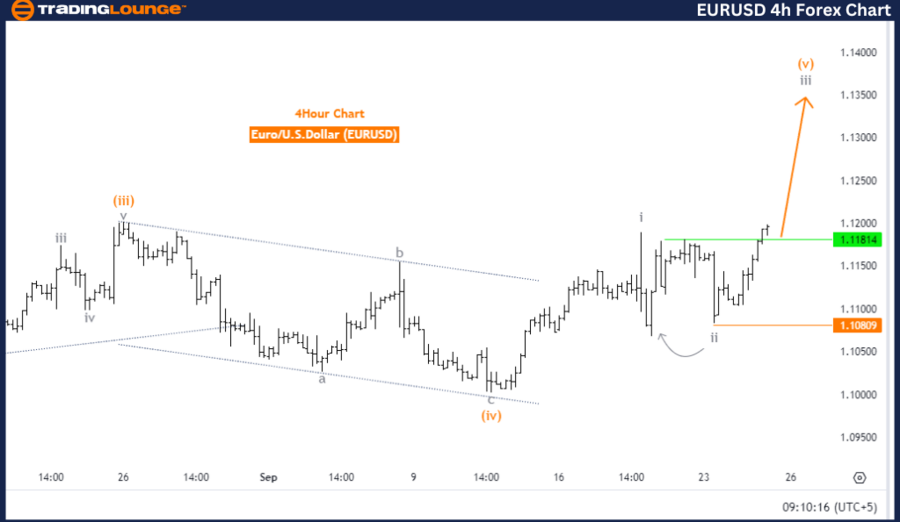
Details: Gray wave 2 seems to have completed, with gray wave 3 now in progress.
Wave Cancellation Invalid Level: 1.10809
The EURUSD Elliott Wave analysis on the 4-hour chart indicates a strong bullish trend, driven by an impulsive wave structure. The current wave is labeled as gray wave 3, while the position is described as orange wave 5. This suggests that the market is in the final sub-wave of gray wave 3.
Earlier, gray wave 2 (a corrective phase) seems to have concluded. As gray wave 3 unfolds, the bullish trend continues. In Elliott Wave theory, wave 3 often exhibits the strongest upward momentum and is typically the longest and most dynamic wave in a sequence.
Looking ahead, the likely development is the formation of gray wave 4, a corrective phase that follows the completion of gray wave 3 and its orange wave 5 sub-wave. Afterward, the market could resume its upward movement with gray wave 5.
As long as the price remains above the invalidation level of 1.10809, the current wave structure remains valid. A breach below this level would invalidate the wave count, potentially signaling a shift in market dynamics or a possible trend reversal.
Technical Analyst: Malik Awais
Source: visit Tradinglounge.com and learn From the Experts Join TradingLounge Here
Previous: Australian Dollar/U.S. Dollar (AUDUSD) Elliott Wave Technical Analysis
VALUE Offer - Buy 1 Month & Get 3 Months!Click here
Access 7 Analysts Over 200 Markets Covered. Chat Room With Support
Conclusion:
The EURUSD 4-hour chart confirms a robust bullish trend, with gray wave 3 in progress after the completion of gray wave 2. As long as the price stays above 1.10809, the bullish trend is expected to persist, followed by a brief corrective phase in gray wave 4, before continuing upward movement in gray wave 5.