09Dec

ASX: WiseTech Global Limited (WTC) - Elliott Wave Analysis, Stock Trends, Technical Charts, Price Forecasts, and Trading Strategies

ASX: WISETECH GLOBAL LIMITED - WTC Elliott Wave Technical Analysis

Greetings, our updated Elliott Wave analysis focuses on the Australian Stock Exchange (ASX) and WISETECH GLOBAL LIMITED (ASX:WTC). The stock appears to continue its upward momentum within a 5-grey wave pattern.

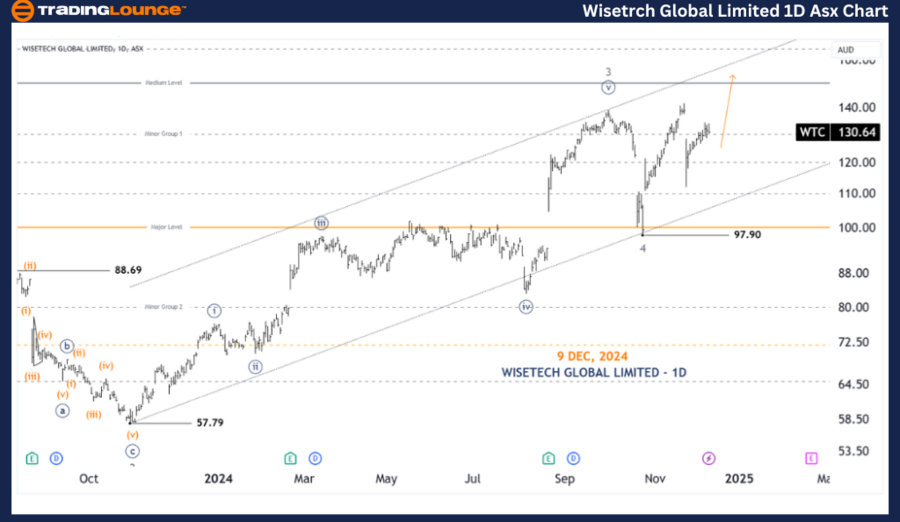
ASX: WISETECH GLOBAL LIMITED - WTC 1D Chart (Semilog Scale) Analysis

Function: Major trend (Minor degree, grey)

Mode: Motive

Structure: Impulse

Position: Wave 5-grey of Wave (3)-orange of Wave ((1))-navy

Details:
Wave 4-grey seems to have concluded around the 97.90 mark, setting the stage for wave 5-grey to progress further upward.

  • Invalidation point: 97.90

WISETECH-GLOBAL-LIMI...


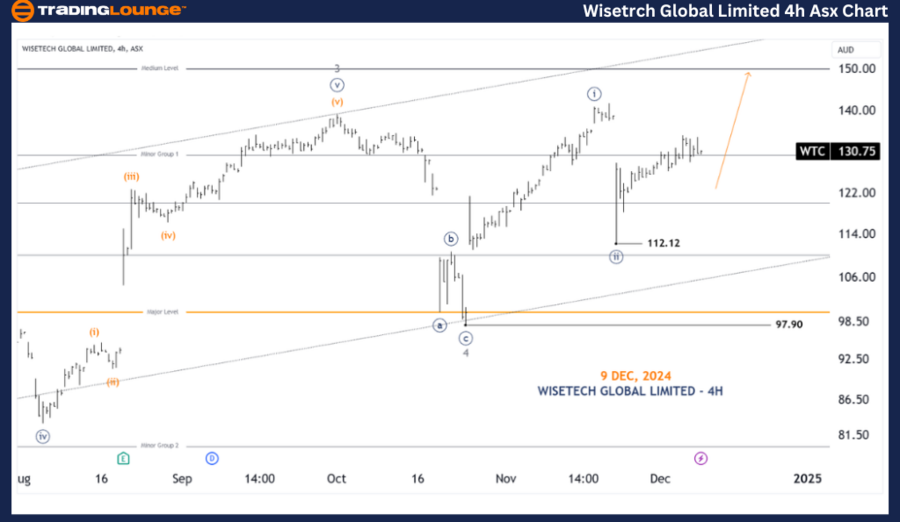
ASX: WISETECH GLOBAL LIMITED - WTC 4-Hour Chart Analysis

Function: Major trend (Minor degree, grey)

Mode: Motive

Structure: Impulse

Position: Wave ((iii))-navy of Wave 5-grey

Details:
A closer examination suggests wave 4-grey likely ended at 97.90, initiating wave 5-grey. This wave is subdividing further into smaller waves ((i)) and ((ii))-navy, both of which appear to have completed. Following the low at 112.12, wave ((iii))-navy seems to be taking shape as it moves higher.

  • Invalidation point: 112.12

Technical Analyst: Hua (Shane) Cuong, CEWA-M (Master’s Designation).

Source: visit Tradinglounge.com and learn From the Experts Join TradingLounge Here 

See Previous: ASX: BHP GROUP LIMITED - BHP Elliott Wave Technical Analysis  

VALUE Offer - Buy 1 Month & Get 3 Months!Click here

Access 7 Analysts Over 200 Markets Covered. Chat Room With Support

WISETECH-GLOBAL-LIMI...


Conclusion

This analysis aims to provide valuable insights into the ongoing market trends for ASX: WISETECH GLOBAL LIMITED (WTC). By identifying critical price levels that validate or invalidate our Elliott Wave count, we ensure an objective view of the stock's potential movements. This approach helps traders effectively interpret market trends and make informed decisions with enhanced confidence.

Related

NVIDIA Corp.(NVDA) Stock Elliott Wave Technical Analysis : Market analysis shows NVDA Stock performance.

NVIDIA Corp.(NVDA) Stock Elliott Wave Technical Analysis : Market analysis shows NVDA Stock performance.

This detailed analysis leverages the Elliott Wave Theory to provide a deep dive into NVIDIA Corporat...

Read More >
Examines the Commodity market's corrective wave structures for Iron Ore Elliott Wave Technical Analysis

Examines the Commodity market's corrective wave structures for Iron Ore Elliott Wave Technical Analysis

This article provides an in-depth Elliott Wave analysis of the iron ore market, focusing on current ...

Read More >
EURGBP Elliott Wave Analysis Reveals Bearish Wave 3 Setup with Short-Term Trade Opportunities in Corrective Market Pattern

EURGBP Elliott Wave Analysis Reveals Bearish Wave 3 Setup with Short-Term Trade Opportunities in Corrective Market Pattern

EURGBP shows a bearish Elliott Wave setup within a corrective structure. Wave 3 is unfolding, offeri...

Read More >
NEE Stocks Elliott Wave Technical Analysis: NextEra Energy Inc. (NEE) Stock Analysis & Strategic Forecast

NEE Stocks Elliott Wave Technical Analysis: NextEra Energy Inc. (NEE) Stock Analysis & Strategic Forecast

This article offers an in-depth Elliott Wave analysis of NextEra Energy Inc. (NEE), breaking down bo...

Read More >
SPDR Select Sector Fund ETF – XLF Elliott Wave Analysis Projects Wave 3 Breakout with Key Support and Bullish ETF Trading Opportunity

SPDR Select Sector Fund ETF – XLF Elliott Wave Analysis Projects Wave 3 Breakout with Key Support and Bullish ETF Trading Opportunity

XLF is in a bullish wave 3 with targets beyond $52.64. This Elliott Wave analysis highlights key bre...

Read More >
Euro/ U.S. Dollar Elliott Wave Analysis: Structured Framework for Analyzing Potential EURUSD Price Action and Trading Opportunities

Euro/ U.S. Dollar Elliott Wave Analysis: Structured Framework for Analyzing Potential EURUSD Price Action and Trading Opportunities

EURUSD Elliott Wave analysis indicates a bullish trend, with Navy Blue Wave 1 forming within Gray Wa...

Read More >

$1 for 2 Weeks

then $29 a month!

What a Special Offer!

Trade Recommendations

Unleash the power of deversified trading with our comprehensive portfolio, covering 250+ markets:

  • Stock Trades
  • Crypto Trades
  • Forex Trades
  • Commodity Trades
Elliott Wave Analysis

Gain a competitive edge with expert insights and AI-powered Elliott Wave charting into:

  • Global Indices
  • US Stocks & ASX Stocks
  • Forex & Crypto
  • Commodities
Top-Notch Trading Tools

Equip yourself with the tools of success:

  • Real-time Chat rooms
  • Elliott Wave Algorithm
  • Portfolio tools
  • TradingLevels
  • Screener
  • Trading Game
7 Elliott Wave Analysts

Stay ahead of the market with daily charts and insightful videos
Your secret to strategic trading!

JOIN HERE


Welcome to TradingLounge (ASIC A.R.No. 321187), specialists in trades, trading education and technical analysis, covering stocks, indices, commodities, forex and cryptocurrencies.

When you join TradingLounge you have access to everything we offer, including trade tools, educational content and a social platform to chat with like-minded investors.

Read more

@Copyright 2024 by tradinglounge.com

Contact Us

Australian no: 02 4787 6020

International no: +61 (2) 47876020

Pay with:

Find us on