10May

ASX IAG Elliott Wave Forecast Reveals Key Turning Points and Price Targets for Smarter Trading Decisions in Australian Stock Market

ASX: Insurance Australia Group Limited (IAG) - TradingLounge Day Chart

Daily Technical Overview – IAG Stock Forecast Based on Elliott Wave Analysis

IAG Elliott Wave Technical Analysis

Hello Traders,

Today’s update focuses on ASX: Insurance Australia Group Limited (IAG) using Elliott Wave principles to forecast market direction.

Our latest analysis suggests ASX:IAG is approaching the final stage of wave B-grey, implying a potential downward shift. The current chart structure does not indicate a bullish reversal, meaning long trades could carry significant risk.

Technical Breakdown – Daily Chart (Semilog Scale)

Function: Major Trend (Minor degree, grey)

Wave Mode: Motive

Structure: Impulse

Position: Wave c)) - navy within Wave B - grey

Insights:

  • Wave 3) - orange has finished forming a five-wave structure.
  • Wave 4) - orange is unfolding as a Zigzag pattern (A-B-C in grey).
  • Wave A - grey has concluded, while wave B - grey is evolving as an Expanded Flat.
  • Wave c)) - navy is targeting the 8.772 price zone.

Key Invalidation Level: Wave b)) - navy must not fall below 7.100 for this count to hold.

IAG-ASX-Stock-Day-ch...


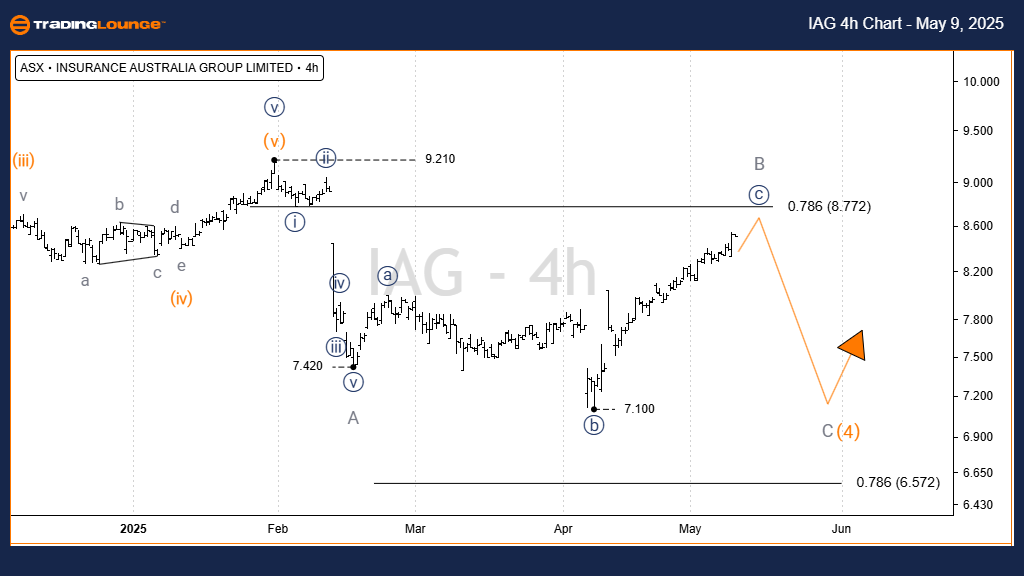
ASX: Insurance Australia Group Limited (IAG) – TradingLounge (4-Hour Chart)

ASX: Insurance Australia Group Limited – IAG Elliott Wave Technical Analysis

This 4-hour chart offers a closer examination of the IAG stock's Elliott Wave pattern, showing how wave B - grey continues forming an Expanded Flat from the 7.420 level.

Technical Breakdown – 4-Hour Chart

Function: Major Trend (Minor degree, grey)

Wave Mode: Motive

Structure: Impulse

Position: Wave c)) - navy within Wave B - grey

Insights:

  • The sequence between wave a)) - navy and wave b)) - navy shows increasing complexity.
  • Wave c)) - navy is gaining momentum, indicating strength versus earlier sub-waves.
  • Target projection for wave c)) - navy is near 8.772, after which wave B - grey is likely to end and wave C - grey may begin its downward move.

Critical Invalidation Level: 7.100 remains a key threshold.

Technical Analyst: Hua (Shane) Cuong, CEWA-M (Master’s Designation).

Source: Visit Tradinglounge.com and learn from the Experts. Join TradingLounge Here 

See Previous: BLOCK, INC - XYZ (SQ2) Elliott Wave Technical Analysis

VALUE Offer - Buy 1 Month & Get 3 Months!Click here

Access 7 Analysts Over 200 Markets Covered. Chat Room With Support

IAG-ASX-Stock-4H-cha...


Conclusion
This Elliott Wave analysis for ASX: Insurance Australia Group Limited (IAG) provides both short-term insights and broader market perspective. By identifying significant wave positions and critical price levels, this forecast enhances traders' understanding of IAG’s market behavior using Elliott Wave theory. Always consider these points in line with market context and risk management.

Related

Texas Instruments Inc.(TXN) Stocks Elliott Wave Technical Analysis: Daily and 4-Hour Elliott Wave Overview

Texas Instruments Inc.(TXN) Stocks Elliott Wave Technical Analysis: Daily and 4-Hour Elliott Wave Overview

This article provides an in-depth Elliott Wave analysis of Texas Instruments Incorporated (TXN), foc...

Read More >
Elliott Wave Analysis: S&P 500, NASDAQ 100, DAX 40, FTSE 100, ASX200 Trading Strategies

Elliott Wave Analysis: S&P 500, NASDAQ 100, DAX 40, FTSE 100, ASX200 Trading Strategies

Elliott Wave Analysis indicates a 'Risk On' sentiment for ASX 200, DAX 40, and FTSE 100. The...

Read More >
Unlocking the Future of SMCI: Super Micro Computer Inc.(SMCI) Stocks Elliott Wave Technical Analysis

Unlocking the Future of SMCI: Super Micro Computer Inc.(SMCI) Stocks Elliott Wave Technical Analysis

Dive into our comprehensive Elliott Wave analysis of Super Micro Computer Inc. (SMCI). This article ...

Read More >
Dogecoin / U.S. dollar(DOGEUSD) Elliott Wave Technical Analysis 20 December 23

Dogecoin / U.S. dollar(DOGEUSD) Elliott Wave Technical Analysis 20 December 23

TradingLounge Elliott Wave Technical 4-Hour and day chart Analysis of Dogecoin / U.S. dollar(DOGEUSD...

Read More >
U.S. Dollar / Canadian Dollar Elliott Wave Technical Analysis: Navigate the Current Market Structure of USDCAD Effectively

U.S. Dollar / Canadian Dollar Elliott Wave Technical Analysis: Navigate the Current Market Structure of USDCAD Effectively

This article provides an in-depth Elliott Wave analysis of the USDCAD currency pair. With insights o...

Read More >
Shanghai Composite Index Elliott Wave Technical Analysis: Master Market Trends and Wave Structures

Shanghai Composite Index Elliott Wave Technical Analysis: Master Market Trends and Wave Structures

The Elliott Wave analysis of the Shanghai Composite provides a thorough insight into market trends a...

Read More >

$1 for 2 Weeks

then $29 a month!

What a Special Offer!

Trade Recommendations

Unleash the power of deversified trading with our comprehensive portfolio, covering 250+ markets:

  • Stock Trades
  • Crypto Trades
  • Forex Trades
  • Commodity Trades
Elliott Wave Analysis

Gain a competitive edge with expert insights and AI-powered Elliott Wave charting into:

  • Global Indices
  • US Stocks & ASX Stocks
  • Forex & Crypto
  • Commodities
Top-Notch Trading Tools

Equip yourself with the tools of success:

  • Real-time Chat rooms
  • Elliott Wave Algorithm
  • Portfolio tools
  • TradingLevels
  • Screener
  • Trading Game
7 Elliott Wave Analysts

Stay ahead of the market with daily charts and insightful videos
Your secret to strategic trading!

JOIN HERE


Welcome to TradingLounge (ASIC A.R.No. 321187), specialists in trades, trading education and technical analysis, covering stocks, indices, commodities, forex and cryptocurrencies.

When you join TradingLounge you have access to everything we offer, including trade tools, educational content and a social platform to chat with like-minded investors.

Read more

@Copyright 2024 by tradinglounge.com

Contact Us

Australian no: 02 4787 6020

International no: +61 (2) 47876020

Pay with:

Find us on