Bitcoin/ U.S. Dollar (BTCUSD) Elliott Wave Analysis Daily Chart
On February 14, the Elliott Wave Analysis from TradingLounge delved into the technical intricacies of Bitcoin paired with the U.S. dollar (BTCUSD). This analysis focuses on guiding traders through complex market trends using the Elliott Wave Theory.
BTCUSD Elliott Wave Technical Analysis Overview
Function: Following Trends
Mode: Motive
Structure: Impulse
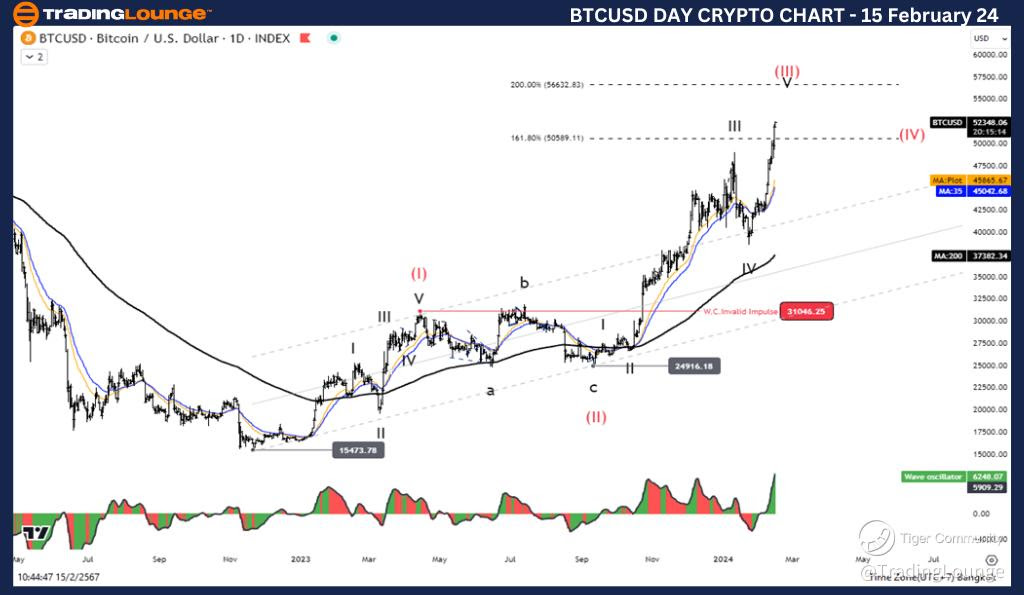
Position: Wave V
Next Higher Degree Direction: Wave (III)
Invalidation Level: 31046.25
BTCUSD Trading Strategy: The analysis suggests that Wave II correction may have concluded around the 81.485 level, signaling a potential bullish trend resurgence. Anticipating a five-wave increase, traders are urged to consider this pattern as a supportive factor in their decision-making process.
Technical Indicators: The price movement remains above the MA200, indicating an uptrend in motion. Additionally, Wave Oscillators signal a bullish momentum, providing further confidence in the upward trajectory of BTCUSD
Technical Analyst: Kittiampon Somboonsod, CEWA
BTCUSD Elliott Wave Technical Analysis - 4Hr Chart:
Function: Following Trends
Mode: Motive
Structure: Impulse
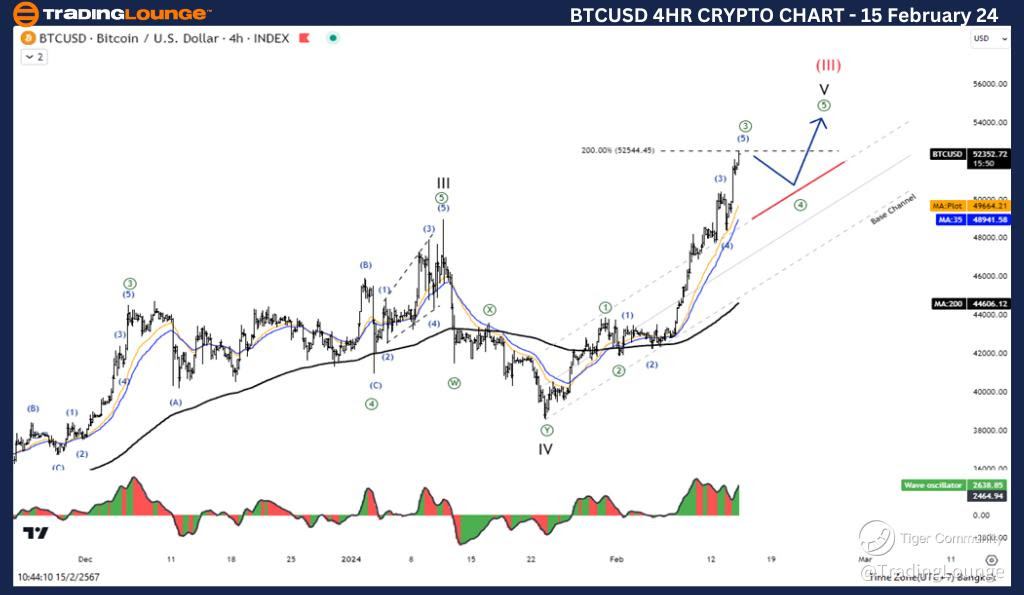
Position: Wave V
Next Higher Degree Direction: Wave (III)
Invalidation Level: 31046.25
Details: The analysis underscores an ongoing rise in Wave (III), extending into Wave V. There's potential for testing the 56632.83 level, representing the 200% level of Wave (I). Traders are advised to monitor this development closely for potential opportunities.
Technical Indicators: Similar to the daily chart analysis, technical indicators on the 4-hour chart support the bullish sentiment. The price remains above the MA200, reaffirming the uptrend, while Wave Oscillators further bolster the bullish momentum.
Technical Analyst: Kittiampon Somboonsod, CEWA
Source: visit Tradinglounge.com and learn From the Experts Join TradingLounge Here
See Previous: AAVE/ U.S. dollar(AAVEUSD)
In Conclusion: The BTCUSD Elliott Wave Technical Analysis for February 14 provides valuable insights into market trends and potential trading strategies. With a focus on Elliott Wave Theory and technical indicators, traders are equipped to make informed decisions amidst the dynamic cryptocurrency landscape. Stay tuned for further updates and analysis from TradingLounge to navigate the BTCUSD market effectively.