22Apr

NEO Elliott Wave Forecast Reveals Bullish Trade Setup With Wave III Breakout Signal on Daily and H4 Technical Analysis Charts

NEOUSD Elliott Wave Analysis – TradingLounge Daily Chart

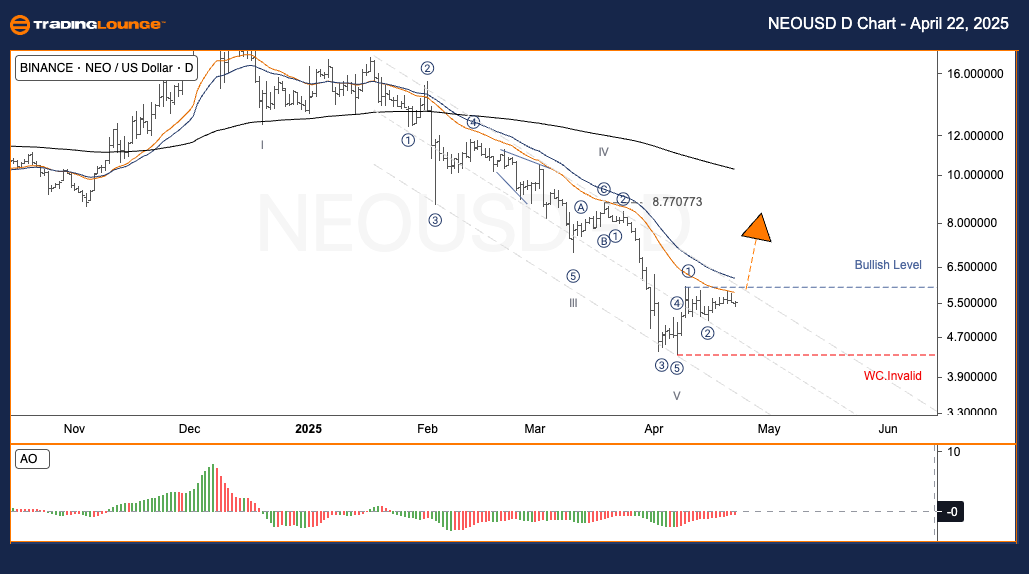
NEO/USD (NEOUSD) Daily Chart Analysis

NEOUSD Elliott Wave Technical Overview

Function: Counter Trend

Mode: Corrective

Structure: Zigzag

Position: Wave ((C))

Next Major Direction: Wave Y

Wave Invalidation Level: Not defined

NEO/USD Trading Strategy – Daily Chart

NEO continues its bearish trajectory, in alignment with Elliott Wave analysis since early 2025. The final leg of Wave (V) appears complete, suggesting the market is approaching a critical reversal zone. A confirmed move above the 6.60 resistance level could initiate a powerful Wave III rally.

Trading Strategy Overview

✅ Swing Trade Opportunity (Short-Term Traders)
A bullish breakout through 6.60 may signal the start of Wave III—typically the most impulsive and high-velocity phase in Elliott Wave sequences.

⚠️ Risk Management Tip

If the price declines below the invalidation threshold (W.C. Invalid), the bullish scenario is negated. A fresh Elliott Wave count will be required to realign with market structure.

NEOUSD-Crypto-Day-Ch...


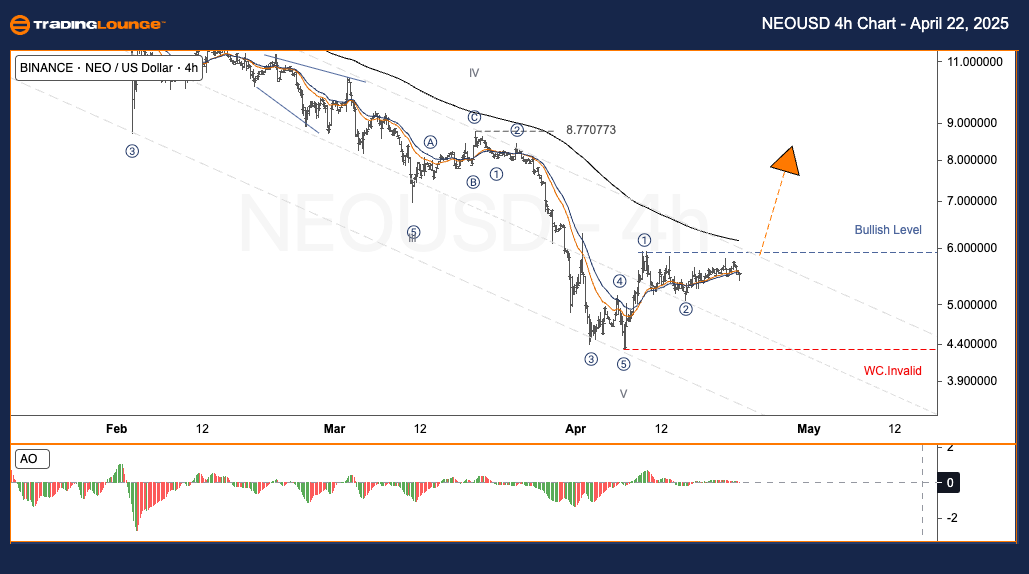
NEO/USD (NEOUSD) Elliott Wave Analysis – TradingLounge H4 Chart

NEOUSD Elliott Wave Technical Analysis

Function: Counter Trend

Mode: Corrective

Structure: Zigzag

Position: Wave ((C))

Next Major Direction: Wave Y

Wave Invalidation Level: Not defined

NEO/USD Trading Strategy – H4 Chart

NEO’s downward movement continues in accordance with Elliott Wave theory. Signs now point to a completed five-wave structure within Wave V, positioning the market near a potential bullish reversal. A confirmed break above 6.60 could launch Wave III, offering traders a high-momentum opportunity.

Trading Strategy Overview

✅ Swing Trade Opportunity (Short-Term Traders)
A move beyond the 6.60 resistance presents a potential entry for riding Wave III’s strong upward momentum.

⚠️ Risk Management Tip
Failure to hold above the invalidation level cancels the bullish outlook. Traders should reevaluate the wave count and wait for renewed confirmation.

Technical Analyst: Kittiampon Somboonsod, CEWA

Source: Visit Tradinglounge.com and learn from the Experts. Join TradingLounge Here 

Previous: DOTUSD Elliott Wave Technical Analysis

VALUE Offer - Buy 1 Month & Get 3 Months!Click here

Access 7 Analysts Over 200 Markets Covered. Chat Room With Support

NEOUSD-Crypto-4h-Cha...

Related

Iron Ore (SGX TSI Index Futures) Elliott Wave Technical Analysis: It Examines key Price Movementsand Potential Corrections

Iron Ore (SGX TSI Index Futures) Elliott Wave Technical Analysis: It Examines key Price Movementsand Potential Corrections

This article provides an in-depth Elliott Wave analysis of the SGX TSI Iron Ore Index, focusing on l...

Read More >
Comprehensive Elliott Wave Technical Analysis of Crude Oil WTI: A Guide for Traders

Comprehensive Elliott Wave Technical Analysis of Crude Oil WTI: A Guide for Traders

Elliott Wave analysis indicates a bullish correction trend in Crude Oil WTI. The market is currently...

Read More >
Indian Stock Market Update on OIL & NATURAL Gas Co. Stock Analysis: ONGC Elliott Wave Technical Analysis & Price Prediction

Indian Stock Market Update on OIL & NATURAL Gas Co. Stock Analysis: ONGC Elliott Wave Technical Analysis & Price Prediction

Discover comprehensive ONGC stock analysis featuring Elliott Wave forecasts, technical analysis, and...

Read More >
Polkadot Forecast and DOTUSD Elliott Wave Analysis, Confirming Bullish Breakout and Trend Continuation from Fibonacci Zone

Polkadot Forecast and DOTUSD Elliott Wave Analysis, Confirming Bullish Breakout and Trend Continuation from Fibonacci Zone

Polkadot (DOT) is showing bullish momentum, entering wave 3 after a Zigzag correction. Elliott Wave ...

Read More >
Polkadot Crypto Price News Today Elliott Wave Technical Analysis of Polkadot (DOT/USD): Comprehensive Guide

Polkadot Crypto Price News Today Elliott Wave Technical Analysis of Polkadot (DOT/USD): Comprehensive Guide

This article provides an in-depth Elliott Wave analysis of Polkadot (DOT/USD), offering insights int...

Read More >
Bovespa Index Elliott Wave Count Signals Bullish Market Trend With Strong Impulse Waves and Key Technical Support Levels

Bovespa Index Elliott Wave Count Signals Bullish Market Trend With Strong Impulse Waves and Key Technical Support Levels

Discover a bullish Elliott Wave analysis of the Bovespa Index with clear daily and weekly wave count...

Read More >

$1 for 2 Weeks

then $29 a month!

What a Special Offer!

Trade Recommendations

Unleash the power of deversified trading with our comprehensive portfolio, covering 250+ markets:

  • Stock Trades
  • Crypto Trades
  • Forex Trades
  • Commodity Trades
Elliott Wave Analysis

Gain a competitive edge with expert insights and AI-powered Elliott Wave charting into:

  • Global Indices
  • US Stocks & ASX Stocks
  • Forex & Crypto
  • Commodities
Top-Notch Trading Tools

Equip yourself with the tools of success:

  • Real-time Chat rooms
  • Elliott Wave Algorithm
  • Portfolio tools
  • TradingLevels
  • Screener
  • Trading Game
7 Elliott Wave Analysts

Stay ahead of the market with daily charts and insightful videos
Your secret to strategic trading!

JOIN HERE


Welcome to TradingLounge (ASIC A.R.No. 321187), specialists in trades, trading education and technical analysis, covering stocks, indices, commodities, forex and cryptocurrencies.

When you join TradingLounge you have access to everything we offer, including trade tools, educational content and a social platform to chat with like-minded investors.

Read more

@Copyright 2024 by tradinglounge.com

Contact Us

Australian no: 02 4787 6020

International no: +61 (2) 47876020

Pay with:

Find us on