SGX TSI Iron Ore Index Elliott Wave Analysis

The SGX TSI Iron Ore Index serves as a vital benchmark in the iron ore market, offering key insights for traders, miners, and steelmakers engaged in contract settlements and price risk management. The index's performance reflects actual transactions in the iron ore spot market, providing a reliable indicator of current market conditions.

Iron Ore Index Elliott Wave Technical Analysis

Overview and Long-Term Analysis

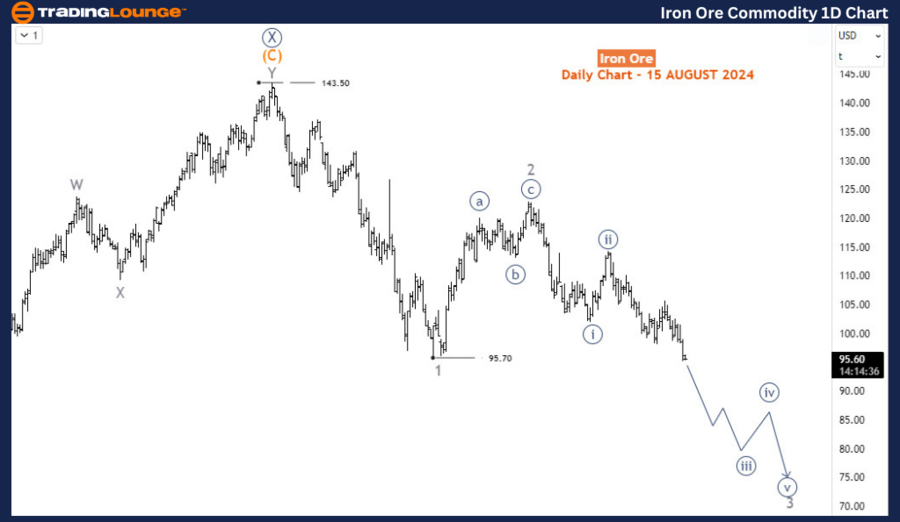
The index reached its peak in May 2021, hitting an all-time high of approximately $233 per dry metric ton, driven by robust demand from China and supply constraints among major producers. Since then, it has experienced a significant correction, declining over 68% to $73 by October 2022. A recovery followed, pushing the index to $143.5 by December 2023. However, after a major recovery in April and May 2024, the commodity is now reversing those gains, continuing the sell-off that began in January 2024.

In the long term, the index initiated a bearish corrective phase in May 2021, forming a primary wave W-X-Y (circled). The primary degree waves W and X (circled) concluded at the October 2022 low and January 2024 high, respectively. Wave Y (circled) commenced at the January 2024 high of 143.5 and is anticipated to evolve into a 3-wave structure consisting of intermediate degree waves (A)-(B)-(C). Currently, the price is in wave 3 of (A), with the potential to extend down to 45, indicating a bearish long-term outlook for the index based on Elliott Wave theory.

Iron-Ore-Commodity-1...


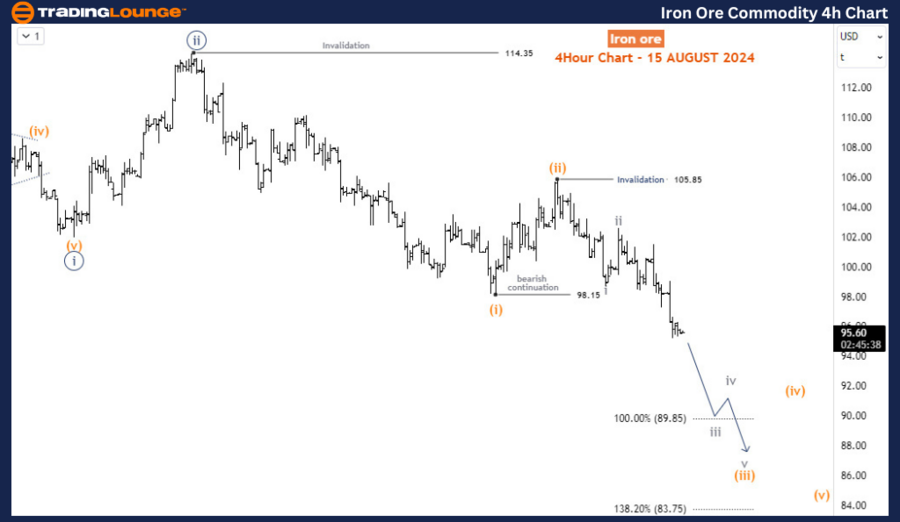
Iron Ore 4-Hour Chart Analysis

On the H4 chart, wave 3 began at 122.9 and is currently unfolding its 3rd sub-wave, wave iii (circled) of 3. A closer examination reveals that the price is in wave (iii) of iii (circled) of 3. In the near term, wave (iii) could reach 85 before a corrective bounce for wave (iv) and then resume its downward trend.

Conclusion

The SGX TSI Iron Ore Index is experiencing a significant bearish correction after peaking in May 2021. The long-term outlook indicates further downside potential, with the index likely to continue its decline as part of a broader corrective wave structure. While short-term bounces are possible, traders should remain cautious and aware of the prevailing bearish trend.

Technical Analyst: Sanmi Adeagbo

Source: visit Tradinglounge.com and learn From the Experts Join TradingLounge Here 

See Previous: Wheat Elliott Wave Technical Analysis

Special Trial Offer - 0.76 Cents a Day for 3 Months! Click here

Access 7 Analysts Over 170 Markets Covered. Chat Room With Support

Iron-Ore-Commodity-4...

Related

Uniswap / U.S. dollar(UNIUSD) Elliott Wave Technical Analysis 12 January 24

Uniswap / U.S. dollar(UNIUSD) Elliott Wave Technical Analysis 12 January 24

Uniswap/U.S. dollar(UNIUSD) Elliott Wave Technical Analysis dated 12 January 24, Uniswap / U.S. doll...

Read More >
Deere & Co. (DE) Stocks Elliott Wave Technical Analysis: Key Support Levels, Forecasts, and Technical Outlook

Deere & Co. (DE) Stocks Elliott Wave Technical Analysis: Key Support Levels, Forecasts, and Technical Outlook

This comprehensive Elliott Wave analysis of Deere & Co. (DE) offers traders valuable insights into t...

Read More >
Bitcoin / U.S. dollar(BTCUSD) Elliott Wave Technical Analysis 21 November 23

Bitcoin / U.S. dollar(BTCUSD) Elliott Wave Technical Analysis 21 November 23

Bitcoin/U.S. dollar(BTCUSD) Elliott Wave Technical Analysis on 21 November 23 with BTCUSD Analysis D...

Read More >
Ethereum Crypto Price News Today Ethereum against the U.S. Dollar ETHUSD Elliott Wave Technical Analysis

Ethereum Crypto Price News Today Ethereum against the U.S. Dollar ETHUSD Elliott Wave Technical Analysis

This in-depth article offers a strategic approach to trading Ethereum against the U.S. Dollar (ETH/U...

Read More >
The Coca-Cola Company (KO) Stocks Elliott Wave Technical Analysis to make Decisions based on the latest Market Structure

The Coca-Cola Company (KO) Stocks Elliott Wave Technical Analysis to make Decisions based on the latest Market Structure

Discover a detailed Elliott Wave analysis for Coca-Cola (KO) stock, providing insights into potentia...

Read More >
Elliott Wave Analysis: How CPI Figures Impact S&P 500, NASDAQ, DAX 40, and More

Elliott Wave Analysis: How CPI Figures Impact S&P 500, NASDAQ, DAX 40, and More

The latest Elliott Wave Analysis indicates a market response to rising CPI figures, leading to a dow...

Read More >

Buy 1 Month

Get 3 Months!

Special Offer:

Trade Recommendations

Unleash the power of deversified trading with our comprehensive portfolio, covering:

  • Stock Trades
  • Crypto Trades
  • Forex Trades
  • Commodity Trades
Elliott Wave Analysis

Gain a competive edge with expert insights in to:

  • Global Indices
  • US Stocks & ASX Stocks
  • Forex & Crypto
  • Commodities
Top-Notch Trading Tools

Equip yourself with the tools of success:

  • Social Chat
  • Elliott Wave Algorithm
  • Screener
  • TradingLevels
  • Trading Game
7 Elliott Wave Analysts

Stay ahead of the market with daily charts and insightful videos
-Your secret to strategic trading!

JOIN HERE


Welcome to TradingLounge (ASIC A.R.No. 321187), specialists in trades, trading education and technical analysis, covering stocks, indices, commodities, forex and cryptocurrencies.

When you join TradingLounge you have access to everything we offer, including trade tools, educational content and a social platform to chat with like-minded investors.

Read more

@Copyright 2024 by tradinglounge.com

Contact Us

Australian no: 02 4787 6020

International no: +61 (2) 47876020

Pay with:

Find us on