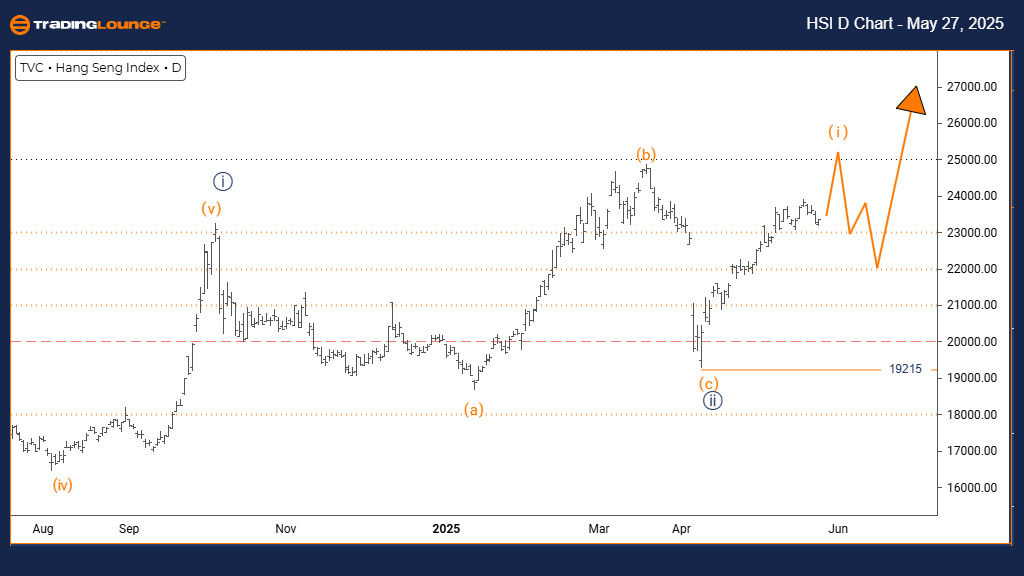
Hang Seng Index – Elliott Wave Analysis (Trading Lounge Day Chart)
Hang Seng Index Technical Wave Analysis
FUNCTION: Bullish Trend
MODE: Impulsive
STRUCTURE: Orange Wave 1
POSITION: Navy Blue Wave 3
DIRECTION NEXT LOWER DEGREES: Orange Wave 2
DETAILS: Completion likely for navy blue wave 2; development underway for orange wave 1 of 3.
Wave Cancel Invalid Level: 19215
Market Overview
The Hang Seng Index daily chart signals a confirmed bullish trend. Orange wave 1 has started within navy blue wave 3, suggesting the correction phase of navy blue wave 2 has ended. This configuration typically marks the early stages of an extended upward move.
Wave Structure and Momentum
Completion of navy blue wave 2 appears confirmed, with orange wave 1 currently progressing. This impulsive structure highlights strong buying activity. The ongoing setup indicates a high potential for continued upward momentum. Traders should closely watch the 19215 level, serving as a key invalidation threshold.
Investment Outlook
This wave pattern offers traders and investors a structured market view. The Hang Seng Index likely entered the early leg of a new rally. A corrective orange wave 2 is expected once wave 1 completes. Tracking trend momentum and retracement levels is essential for optimal trade management.
Strategy Note
Traders should be alert for signs indicating the end of wave 1 and prepare for an expected pullback. While early bullish signs are clear, wave 1 commonly precedes a correction. Maintaining disciplined risk controls is vital at this early rally phase.
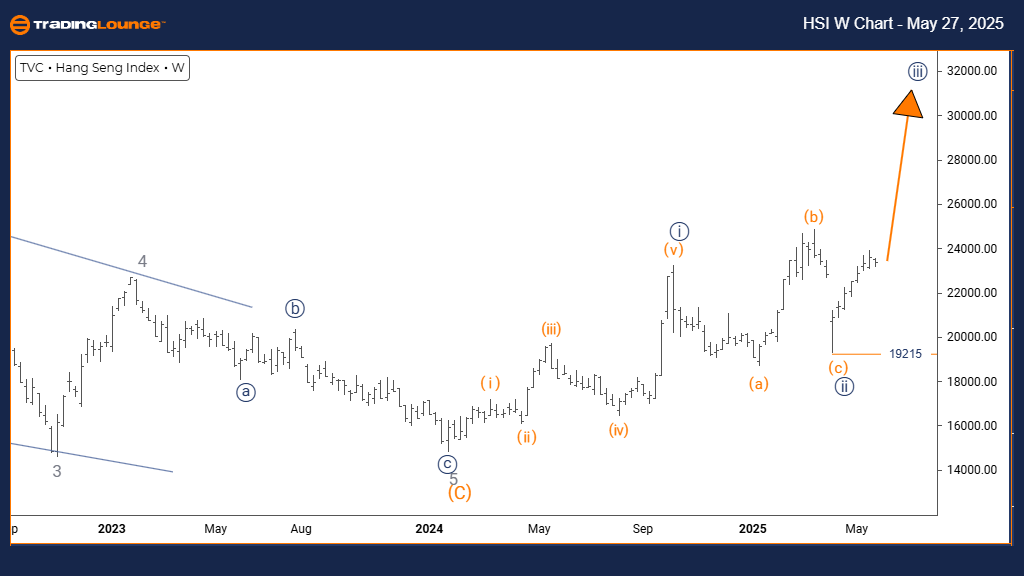
Hang Seng Index – Elliott Wave Analysis (Trading Lounge Weekly Chart)
Hang Seng Index Wave Technical Analysis
FUNCTION: Bullish Trend
MODE: Impulsive
STRUCTURE: Navy Blue Wave 3
POSITION: Gray Wave 1
DIRECTION NEXT HIGHER DEGREES: Navy Blue Wave 3 (active)
DETAILS: Navy blue wave 2 is likely completed; wave 3 development is ongoing.
Wave Cancel Invalid Level: 19215
Market Overview
On the weekly timeframe, the Hang Seng Index continues to show a bullish structure. The emergence of navy blue wave 3 follows the completed correction of navy blue wave 2. Historically, wave 3 within Elliott Wave theory is the most powerful movement in an impulse sequence.
Wave Analysis and Outlook
With navy blue wave 2 concluded, the start of wave 3 is supported by increased buying interest. Internal components within gray wave 1 validate the presence of bullish momentum. Unless the price drops below 19215, the market is expected to sustain this upward direction.
Investment Framework
This technical setup outlines a high-reward stage for long-term investors. The weekly Elliott Wave structure indicates more upside, although corrective phases are inherent to wave patterns. Monitoring trend indicators and wave relationships will support risk-informed decisions.
Positioning Advice
Investors and traders should confirm trend continuation signals while applying tight risk parameters. Despite strength in wave 3, natural pullbacks can still occur. Using 19215 as a risk reference can aid in controlling exposure during this upward leg.
Technical Analyst: Malik Awais
Source: Visit Tradinglounge.com and learn from the Experts. Join TradingLounge Here
Previous: DOW JONES – DJI Index Elliott Wave Technical Analysis
VALUE Offer - Buy 1 Month & Get 3 Months!Click here
Access 7 Analysts Over 200 Markets Covered. Chat Room With Support