ASX: UNIBAIL-RODAMCO-WESTFIELD – URW Elliott Wave Technical Analysis | TradingLounge
URW Elliott Wave Technical Analysis
Overview
This Elliott Wave analysis highlights the Australian Stock Exchange (ASX) stock UNIBAIL-RODAMCO-WESTFIELD (URW). According to the wave count, the stock is advancing in the fifth wave, indicating a possible medium-term uptrend. Despite this, immediate buy conditions remain unfavorable. Below is a detailed breakdown based on current market structure and wave interpretation.
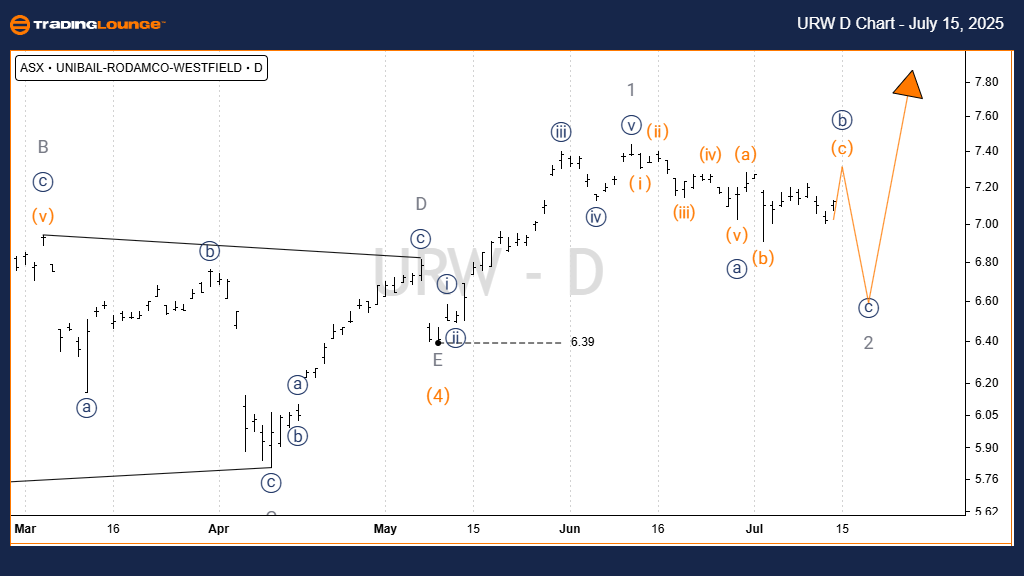
Technical Analysis - Daily Chart
Function: Major trend (Minor degree, grey)
Mode: Motive
Structure: Impulse
Position: Wave 2 - grey of Wave 5 - orange
Details: The corrective Wave 4 - orange ended at 6.39 as a completed triangle (A, B, C, D, E - grey). Currently, Wave 5 - orange is in progress and aiming higher, with a potential target near 8.52. The wave remains active, suggesting more upside is likely.
Invalidation Point: 6.39
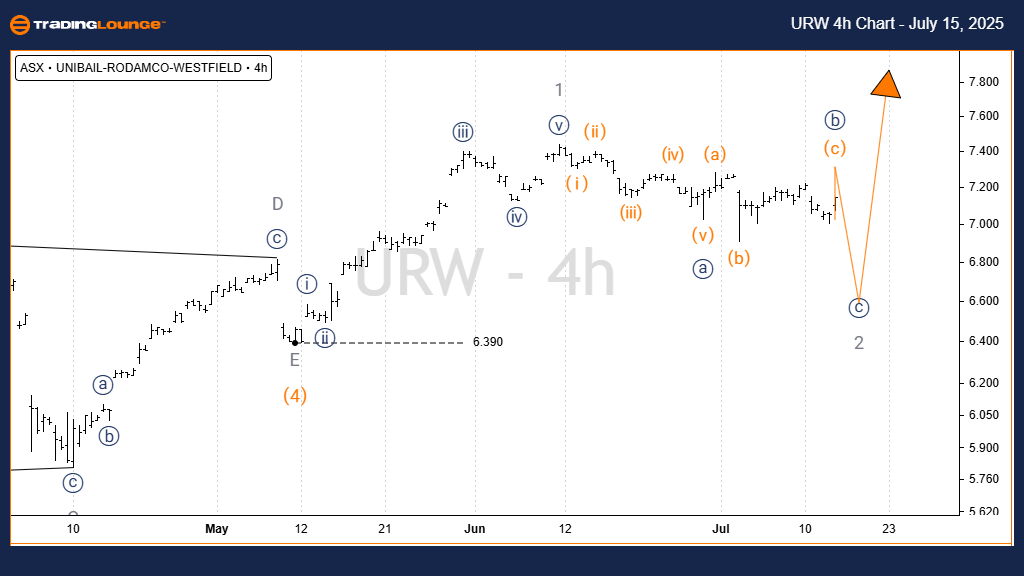
ASX: UNIBAIL-RODAMCO-WESTFIELD – URW Elliott Wave Technical Analysis | TradingLounge (4-Hour Chart)
Function: Major trend (Minor degree, grey)
Mode: Motive
Structure: Impulse
Position: Wave c - orange of Wave b - navy of Wave 2 - grey
Details: The initial Wave 1 - grey completed as a clear five-wave sequence. Now, Wave 2 - grey is developing as a Zigzag labeled a) b) c) - navy. Presently, Wave B - navy is unfolding as an Expanded Flat. A final move downward in Wave c - navy is expected.
Invalidation Point: 6.39
Technical Analyst: Hua (Shane) Cuong, CEWA‑M (Certified Elliott Wave Analyst – Master Level)
Source: Visit Tradinglounge.com and learn from the Experts. Join TradingLounge Here
See Previous: BHP GROUP LIMITED - BHP Elliott Wave Technical Analysis
VALUE Offer - Buy 1 Month & Get 3 Months!Click here
Access 7 Analysts Over 200 Markets Covered. Chat Room With Support
Conclusion
This Elliott Wave forecast for UNIBAIL-RODAMCO-WESTFIELD (URW) on the ASX outlines probable market behavior in both daily and intraday timeframes. By identifying key price levels and wave positions, this analysis improves timing precision and enhances investor decision-making. The chart structure helps traders stay aligned with the dominant wave trend for better strategic positioning.