20Jun

Kotak Mahindra Bank - KOTAKBANK Elliott Wave Technical Chart Shows Bullish Trend With Strong Price Momentum Above 1681

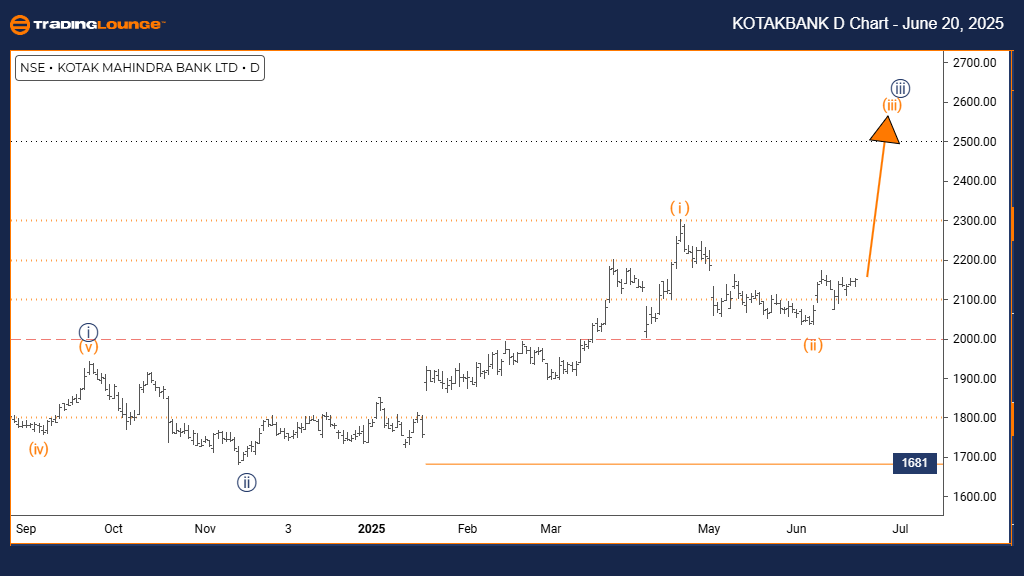
KOTAK BANK Elliott Wave Analysis | Trading Lounge Day Chart

KOTAK BANK Elliott Wave Technical Analysis

FUNCTION: Bullish Trend

MODE: Impulsive

STRUCTURE: Orange wave 3

POSITION: Navy blue wave 3

DIRECTION NEXT LOWER DEGREES: Orange wave 4

DETAILS: Orange wave 2 appears completed; orange wave 3 is unfolding.

Wave Cancel Invalid Level: 1681

The daily Elliott Wave analysis for KOTAK BANK reveals a strong bullish trend. Price behavior is moving in an impulsive wave structure, indicating consistent upside momentum. The current wave count places orange wave 3 in progress, which is a subwave of navy blue wave 3, reflecting a powerful upward phase in the stock's trend.

With orange wave 2 seemingly complete, the market has transitioned into orange wave 3, which is typically the most powerful segment of an impulsive wave structure. Traders can expect a continuation of the uptrend, followed by a corrective move in orange wave 4 once the current wave matures.

The critical invalidation point stands at 1681. A close below this level would invalidate the bullish wave count and necessitate a reevaluation. As long as price action holds above this threshold, the bullish outlook for KOTAK BANK remains solid.

In conclusion, KOTAK BANK is showing signs of strong bullish continuation. The active orange wave 3 suggests intensified buying pressure and potential for higher price levels in the near term.

KOTAKBANK-d-indian-s...


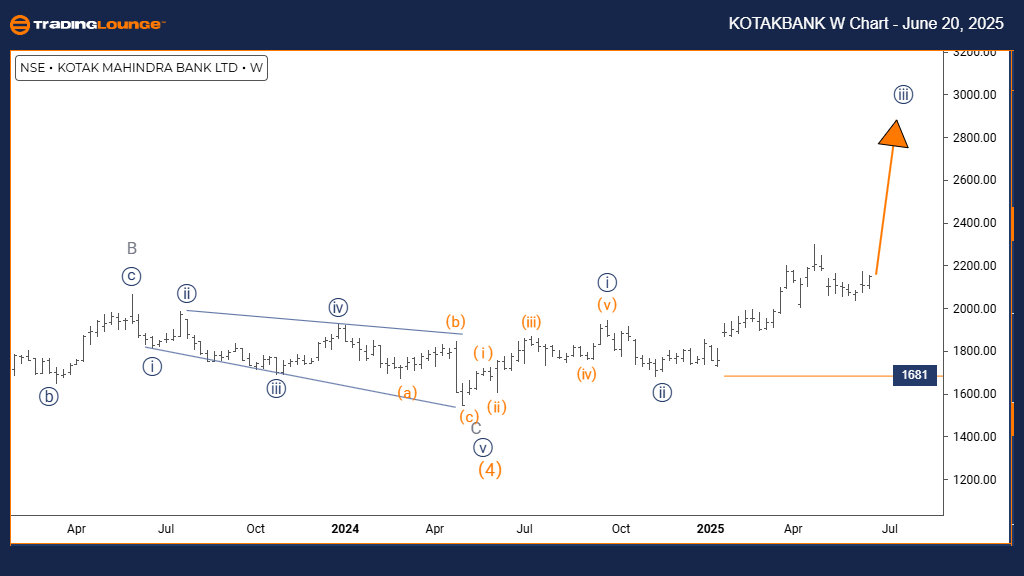
KOTAK BANK Elliott Wave Analysis | Trading Lounge Weekly Chart

KOTAK BANK Elliott Wave Technical Analysis

FUNCTION: Bullish Trend

MODE: Impulsive

STRUCTURE: Navy blue wave 3

POSITION: Gray wave 1

DIRECTION NEXT LOWER DEGREES: Navy blue wave 3 (developing)

DETAILS: Navy blue wave 2 is likely complete; navy blue wave 3 is now progressing.

Wave Cancel Invalid Level: 1681

The weekly Elliott Wave analysis for KOTAK BANK supports a medium-term bullish trend. Price progression continues in impulsive mode, aligning with a strong upward market phase. The current wave analysis indicates navy blue wave 3 is unfolding as part of the broader gray wave 1, suggesting the early development of a significant bullish cycle.

Following the apparent completion of navy blue wave 2, the stock has entered the impulsive navy blue wave 3, typically known for delivering sustained upward movement. The internal substructure of this wave is expected to evolve further, enhancing the bullish sentiment.

As with the daily chart, the invalid level for this wave count remains at 1681. A fall below this mark would negate the current bullish scenario, prompting a revised wave interpretation. While price remains above this key level, KOTAK BANK retains its upward bias.

Overall, the weekly chart underscores a robust bullish setup. The development of navy blue wave 3 within gray wave 1 hints at prolonged upward momentum driven by persistent buying activity.

Technical Analyst: Malik Awais

Source: Visit Tradinglounge.com and learn from the Experts. Join TradingLounge Here

Previous: STATE BANK OF INDIA Elliott Wave Technical Analysis

VALUE Offer - $1 for 2 Weeks then $29 a month!Click here

Access 7 Analysts Over 200 Markets Covered. Chat Room With Support

KOTAKBANK-w-indian-s...

Related

Asx Stock Unibail Rodamco Westfield URW Elliott Wave Technical Forecast: Offers a Clear Outlook on Price Trends and Potential Movements

Asx Stock Unibail Rodamco Westfield URW Elliott Wave Technical Forecast: Offers a Clear Outlook on Price Trends and Potential Movements

Our in-depth Elliott Wave analysis for ASX: UNIBAIL RODAMCO WESTFIELD (URW) offers a clear outlook o...

Read More >
Mastering EURUSD Elliott Wave Technical Analysis: Key Insights for Daily and 4-Hour Forex Forecasts

Mastering EURUSD Elliott Wave Technical Analysis: Key Insights for Daily and 4-Hour Forex Forecasts

This EURUSD Elliott Wave analysis provides a comprehensive look at daily and 4-hour chart structures...

Read More >
Natural Gas Elliott Wave Technical Analysis: Helping Traders Identify Key Entry and Exit Points in the Commodity Market

Natural Gas Elliott Wave Technical Analysis: Helping Traders Identify Key Entry and Exit Points in the Commodity Market

Natural Gas has surged over 120% from its February 2024 low, recovering nearly half of its previous ...

Read More >
Commodity Market Report  Elliott Wave Analysis

Commodity Market Report Elliott Wave Analysis

Commodities | Latest News & Elliott Wave Analysis: US Bond Yields, Forex USDJPY, EURUSD, GBPUSD, AUD...

Read More >
Elliott Wave Analysis: In-Depth Insights for S&P 500, NASDAQ 100, Russell 2000, DAX 40, FTSE 100 & ASX 200

Elliott Wave Analysis: In-Depth Insights for S&P 500, NASDAQ 100, Russell 2000, DAX 40, FTSE 100 & ASX 200

Unlock the power of Elliott Wave Analysis with our detailed examination of major global indices, inc...

Read More >
U.S.Dollar/Japanese Yen (USDJPY) Elliott Wave Technical Analysis 29 January 24

U.S.Dollar/Japanese Yen (USDJPY) Elliott Wave Technical Analysis 29 January 24

The USDJPY Elliott Wave Analysis dated 29 January 24, provides a comprehensive examination of the U....

Read More >

$1 for 2 Weeks

then $29 a month!

What a Special Offer!

Trade Recommendations

Unleash the power of deversified trading with our comprehensive portfolio, covering 250+ markets:

  • Stock Trades
  • Crypto Trades
  • Forex Trades
  • Commodity Trades
Elliott Wave Analysis

Gain a competitive edge with expert insights and AI-powered Elliott Wave charting into:

  • Global Indices
  • US Stocks & ASX Stocks
  • Forex & Crypto
  • Commodities
Top-Notch Trading Tools

Equip yourself with the tools of success:

  • Real-time Chat rooms
  • Elliott Wave Algorithm
  • Portfolio tools
  • TradingLevels
  • Screener
  • Trading Game
7 Elliott Wave Analysts

Stay ahead of the market with daily charts and insightful videos
Your secret to strategic trading!

JOIN HERE


Welcome to TradingLounge (ASIC A.R.No. 321187), specialists in trades, trading education and technical analysis, covering stocks, indices, commodities, forex and cryptocurrencies.

When you join TradingLounge you have access to everything we offer, including trade tools, educational content and a social platform to chat with like-minded investors.

Read more

@Copyright 2024 by tradinglounge.com

Contact Us

Australian no: 02 4787 6020

International no: +61 (2) 47876020

Pay with:

Find us on